Environmental Justice Element
Sacramento County General Plan
Environmental Justice Element
Section titled “Sacramento County General Plan Environmental Justice Element”Adopted December 17, 2019
Resolution 2019-0908
ACKNOWLEDGEMENTS
Section titled “ACKNOWLEDGEMENTS”Board of Supervisors
Section titled “Board of Supervisors”- Patrick Kennedy
- Chairperson Phil Serna
- Vice Chairperson Susan Peters
- Sue Frost
- Don Nottoli
County Administration
Section titled “County Administration”- Nav Gill, County Executive
Office of Planning & Environmental Review
Section titled “Office of Planning & Environmental Review”- Leighann Moffitt, Planning Director
- Todd Smith, Principal Planner, Long Range Planning Section
- John Lundgren, Senior Planner
- Tim Kohaya, Associate Planner - Project Manager
- Kate Rose, Associate Planner
- Kristi Grabow, Associate Planner
- Chris Baker, GIS Analyst II
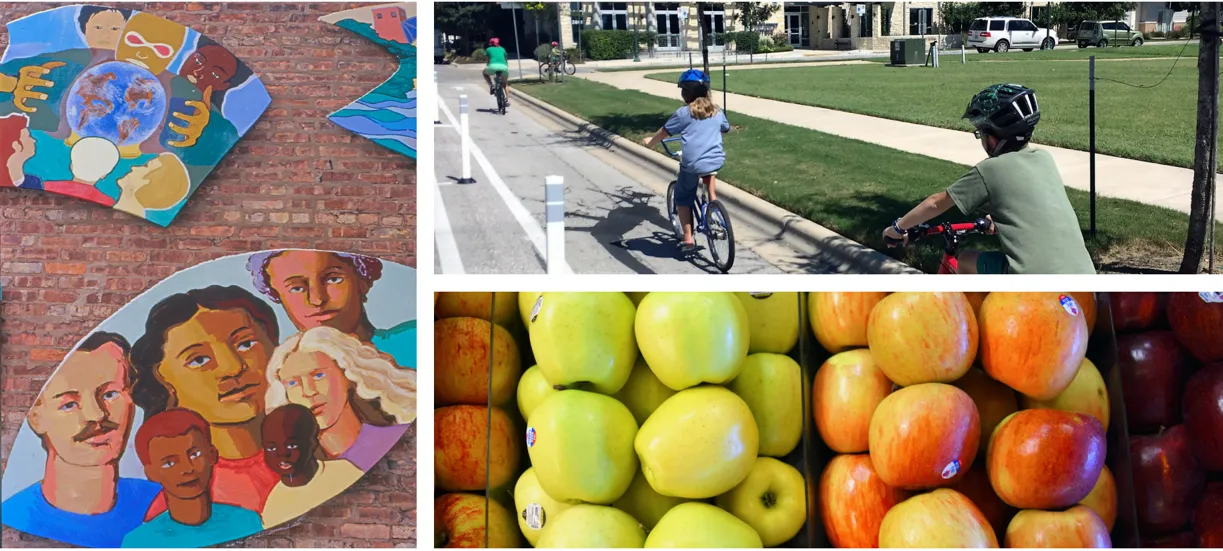
Credits for Pictures on Cover and Title Page
Section titled “Credits for Pictures on Cover and Title Page”Murals
Photo by Sylvia Lewis (CC BY-NC 4.0). Copyright 2008 American Planning Association.
Children on Bikes
Copyright 2016 Greg Griffin, AICP (CC BY-NC 4.0) from the American Planning Association’s Image Library.
Apple Display
Photo by Kelly Wilson (CC BY-NC 4.0). Copyright 2015 American Planning Association.
INTRODUCTION
Section titled “INTRODUCTION”ENVIRONMENTAL JUSTICE
Section titled “ENVIRONMENTAL JUSTICE”Environmental Justice (EJ) seeks to minimize and equalize effects of environmental hazards among the entire community regardless of income, ethnicity or race. The California Government Code (Section 65040.12) defines environmental justice as “The fair treatment and meaningful participation of people of all races, culture and incomes with respect to the development, adoption, implementation, and enforcement of environmental laws, regulations, and policies.”
Issues of environmental justice often arise from geographic or procedural inequities. Geographic inequities occur when neighborhoods with high percentages of low-income residents, minority residents, and/or immigrant communities take more than their share of the worst environmental hazards and resulting health problems from exposure to these hazards. Procedural inequities occur when the same neighborhoods face obstacles to participate in the decision-making process for projects that directly affect their neighborhoods (National City, 3-214). Many factors contribute to these geographic and procedural inequalities. These include a development pattern that concentrates undesirable or unhealthy land uses in certain areas, the placement of desirable public amenities outside of disadvantaged communities and limited or nonexisting political influence among certain demographic groups (California Environmental Justice Alliance, 4).
The purpose of the Environmental Justice Element (EJ Element) is to address public health risks and environmental justice concerns of those living in disadvantaged communities, many of which are the result of geographic or procedural inequities. The County has elected to emphasize the importance of environmental justice by preparing a separate Element rather than integrating environmental justice policies among existing General Plan elements. As provided by State Government Code 65302(h), the EJ Element has the same weight as the mandatory elements of the General Plan and is internally consistent with the other elements. The planning period for this EJ Element is 2019 to 2029 and thereafter will be updated on the same track as the Housing Element.
Environmental Justice encompasses a wide variety of issues and topics.
Photo by Joe Szurszewski (CC BY-NC 4.0). Copyright 2015 American Planning Association.
RELATIONSHIP TO OTHER GENERAL PLAN ELEMENTS
Section titled “RELATIONSHIP TO OTHER GENERAL PLAN ELEMENTS”The EJ Element is closely related to several other General Plan elements, in particular the Land Use, Circulation and Air Quality Elements. Planning decisions related to types of land uses; location, density and intensity of land uses; transportation systems; and street design have a profound impact on both public health and environmental justice. Consequently, the Environmental Justice Element is inextricably connected to the aforementioned elements and other important elements of the General Plan and thus should be read and considered in the context of other General Plan elements. It should also be noted that there are topical areas (e.g., reduce pollution exposure, promote public facilities, and safe and sanitary homes) that are addressed in multiple elements. However, unlike other General Plan Elements, the EJ Element will cover these topical areas from the vantage point of public health and environmental justice communities.
TWO-PHASE PROCESS FOR ENVIRONMENTAL JUSTICE ELEMENT
Section titled “TWO-PHASE PROCESS FOR ENVIRONMENTAL JUSTICE ELEMENT”There were two phases to the development of the EJ Element. During Phase 1, staff conducted baseline research, scoped existing policies and prepared the goals of the EJ Element with two sets of objectives, policies and implementation measures. During Phase 2, staff built upon the efforts of Phase 1 by conducting in-depth public outreach, conducting additional baseline research and, developing new policies and implementation measures that augment or strengthen existing EJ-related policies.
BACKGROUND
Section titled “BACKGROUND”REQUIREMENTS OF STATE GENERAL PLAN LAW
Section titled “REQUIREMENTS OF STATE GENERAL PLAN LAW”State Government Code 65302(h) requires a city or county to ‘identify objectives and policies to reduce unique or compounded health risks in disadvantaged communities’ within their jurisdiction. These objectives and policies must cover the following EJ topical areas:
- Reduce pollution exposure, including improving air quality
- Promote public facilities
- Food access
- Safe and sanitary homes
- Physical activity
California State General Plan Law also requires the identification of objectives and policies that prioritize improvements and programs that address the needs of disadvantaged communities. Finally, State General Plan Law requires identification of jurisdiction-wide objectives and policies that promote civil engagement in the decisionmaking process.
IDENTIFYING ENVIRONMENTAL JUSTICE COMMUNITIES
Section titled “IDENTIFYING ENVIRONMENTAL JUSTICE COMMUNITIES”The EJ Element’s geographic focus of analysis and policies is Environmental Justice Communities (EJ Communities) - areas that are considered disadvantaged compared to other parts of the unincorporated County. Staff used two sources to determine the extent and boundaries of Environmental Justice Communities. One source is the California Communities Environmental Health Screening Tool (more commonly known as CalEnviroScreen). According to State Government Code 65302(h), cities and counties can use this tool to identify disadvantaged communities within their boundaries. CalEnviroScreen takes into account socioeconomic and environmental characteristics and underlying health status of these communities (California Environmental Justice Alliance, 25).
The other source staff used to identify Environmental Justice Communities is the Sacramento Area Council of Governments’ (SACOG) Metropolitan Transportation Plan/Sustainable Communities Strategy (MTP/SCS). State law requires SACOG to conduct an environmental justice and Title VI analysis as part of the MTP\SCS to determine whether the MTP/SCS equitably benefits low-income and minority communities (Sacramento Area Council of Governments, 181). SACOG refers to these areas as Low Income High Minority (LIHM) Areas.
Staff combined CalEPA’s disadvantaged communities with SACOG’s LIHM areas to delineate Environmental Justice Communities (Figure 1). There are four EJ Communities: North Highlands/Foothill Farms, North Vineyard, South Sacramento and West Arden-Arcade. The North Highlands/Foothill Farms EJ Community includes Old Foothill Farms.
Figure 1: Environmental Justice Communities
Section titled “Figure 1: Environmental Justice Communities”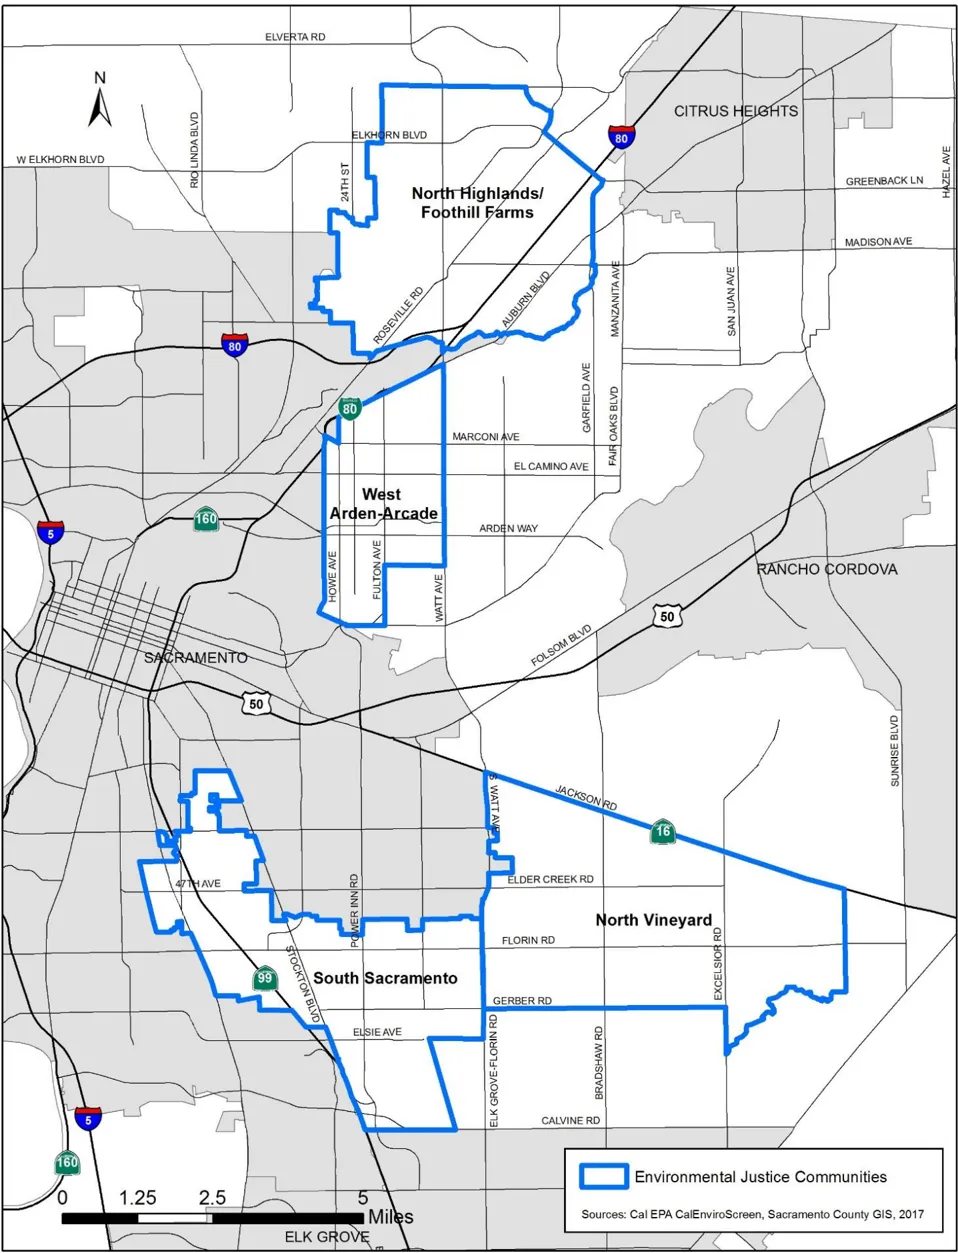
DOCUMENT ORGANIZATION
Section titled “DOCUMENT ORGANIZATION”The EJ Element is divided into sections that cover the required topical areas. State Law allows jurisdictions to add other topics as appropriate and in response, the EJ Element has a section on crime prevention. After the introduction, public participation, and demographic sections, the EJ Element has the following topical sections:
- Prioritizing Improvements and Programs That Address the Needs of Environmental Justice Communities
- Civil Engagement
- Crime Prevention
- Healthy Food Access
- Physical Activity
- Promote Public Facilities
- Reduce Pollution Exposure
- Safe and Sanitary Homes
Each topical section has the following:
- An introduction.
- A summary of baseline research and identification of any inequities between EJ Communities and Non-EJ areas that contribute to EJ Communities having unique or compounded health risks.
- Subsections that cover a particular issue related to the topic. Each subsection contains intent language, objective, policies and implementation measures.
Sections with topics that are covered only in the Environmental Justice Element (such as Healthy Food Access, Physical Activity, Civil Engagement and Crime Prevention) have policies and implementation measures that are applicable to both Environmental Justice Communities and the entire unincorporated County. Other sections with topics that are also covered in other General Plan Elements (such as Reduce Pollution Exposure, Promote Public Facilities and Safe and Sanitary Homes) have policies and implementation measures that are only applicable to Environmental Justice Communities.
ENVIRONMENTAL JUSTICE ELEMENT GOALS
Section titled “ENVIRONMENTAL JUSTICE ELEMENT GOALS”All of the objectives, policies and implementation measures in the EJ Element will have the following goals:
GOALS:
Sacramento County’s built environment provides an equitable degree of protection from environmental and health hazards.
All members of a community can meaningfully participate in any civic public decision-making process.
The first goal addresses geographic inequities that lead to unique or compounded health risks in EJ Communities. The second goal addresses procedural inequities that lead to lack of participation by residents of EJ Communities in the decision-making process. Both goals are directional statements that are applicable to not just EJ Communities but to the entire unincorporated County.
SECTION 1: PROJECT PUBLIC PARTICIPATION
Section titled “SECTION 1: PROJECT PUBLIC PARTICIPATION”The process to prepare the Environmental Justice Element included an extensive public engagement effort. A key environmental justice principle is to involve communities most affected by pollution and other environmental justice issues so that they could have a say in decisions that affect their quality of life. County staff used a variety of public engagement tools to confirm baseline research (ground-truthing), determine the most important community issues and obtain ideas to address those issues. Through these different tools, staff sought to ensure the broadest range of input by inviting participation from the general public, nonprofit organizations, government agencies and particularly community groups and individuals from EJ Communities. Public involvement tools have included:
- Pop-up booths at seven community events.
- Web survey.
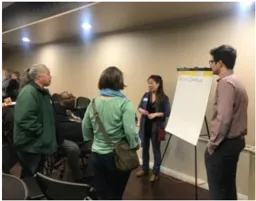
- Three community workshops.
- Meetings with community “hub” groups - groups that have a network of community groups within an Environmental Justice community.
- Meetings with business groups, health, and human services groups.
Due to comments received at these venues, staff revised the initial list of proposed policies and implementation measures for the Environmental Justice Element.
COMMUNITY OUTREACH
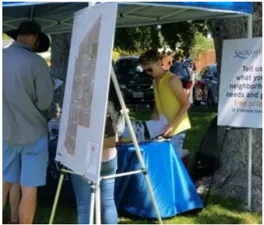
Section titled “COMMUNITY OUTREACH”POP-UP BOOTHS AT COMMUNITY EVENTS
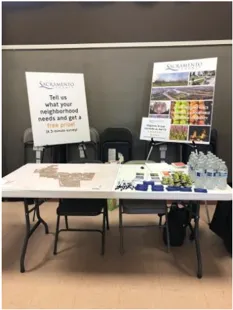
Section titled “POP-UP BOOTHS AT COMMUNITY EVENTS”Staff set up a booth at seven community events (‘pop-up’ booth) during the summer and fall of 2018. Three of the events were held in South Sacramento, two in West Arden-Arcade and two in North Highlands/Foothill Farms. At these events, booth visitors took a survey to receive a small prize. Survey questions covered EJ issues such as healthy food access, physical activity and crime prevention. Booth visitors also participated in a prioritization exercise where they chose which issues were most important to them. Over 100 residents of EJ Communities participated in the surveys with numerous residents of other communities participating as well. A summary of survey responses and list of comments are in Appendix A-1. The following are some conclusions from survey summaries.
- Crime and the perception of increasing crime is a major issue in all of the EJ Communities but particularly in West Arden-Arcade. Surveys taken at events in Arden-Arcade showed that almost 50 percent of the respondents did not feel safe in their neighborhoods.
- A number of North Highlands and Arden-Arcade residents have expressed concern about the safety and lack of bike lanes and sidewalks in their community.
- Access to a grocery store or other sources of fresh fruits and vegetables is an issue with about 30 percent of those who took the survey.
Popup booth set up at community event in West Arden-Arcade
WEB SURVEY
Section titled “WEB SURVEY”Another tool used for the public engagement effort was a web survey through Survey Monkey, an online survey platform. Survey participants answered questions by choosing three items from a list. Each question was related to an EJ topic and selected items enabled staff to determine what was most important to community residents. The web survey was open to the public during October and November 2018 and allowed only residents who lived in certain zip codes to take the survey. Seven hundred nineteen individuals from zip codes that included Environmental Justice Communities took the survey. Survey summaries are in Appendix A-2. Conclusions based on responses include the following:
- The most needed public facilities in each of the EJ Communities are street improvements. Streetlights are also needed in EJ Communities. Homeless shelters are within at least the top four most needed public facilities in all of the EJ Communities except for North Vineyard.
- The high cost of fresh fruits and vegetables is the main reason people are having difficulty getting these items for their families.
- Bike lanes along roadways that have high traffic volumes and speeds are keeping many people from bicycling more. The fear of crime is also keeping many people from bicycling and walking more.
- The high cost of housing is the most important housing issue in all four EJ Communities. Housing overcrowding is an important issue in the North Highlands/Foothill Farms and South Sacramento communities.
- Vacant lots with trash or junk is the most pressing pollution problem in all of the EJ Communities except for North Vineyard. Air pollution from cars and trucks is another pollution problem in EJ Communities.
- A major reason people do not participate in public meetings on topics that affect their neighborhoods is that they think their opinions will not be taken seriously. Another reason is that people feel the meetings will be a waste of time.
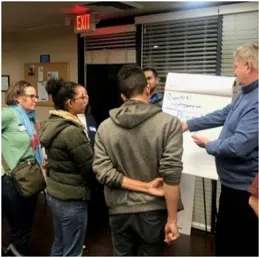
COMMUNITY WORKSHOPS
Section titled “COMMUNITY WORKSHOPS”Staff collaborated with members of the Environmental Justice Advisory Committee to prepare and conduct three community workshops. Staff established the Committee to assist in developing policies, formulating implementation measures, and conducting public outreach. It was comprised of seven subject-matter experts from County and non-profit agencies.
A workshop was held in West Arden-Arcade (October 15, 2018), South Sacramento (October 22, 2018) and North Highlands/Foothill Farms (January 22, 2019). The North Highlands/Foothill Farms workshop was promoted in partnership with Black Child Legacy of North Highlands/Foothill Farms. Each workshop started with a short presentation on environmental justice and the EJ Element project. After the presentation, there were three discussion sessions where workshop participants chose a discussion group covering a particular topic. In each discussion group, participants identified community issues and ways to address those issues. Participants then participated in a dot voting exercise where they selected their preferred ideas to address community issues. The following includes key ideas and the issues that the ideas addressed. See Appendix A-3 for a complete list of identified community issues and ways to address those issues.
West Arden-Arcade Community Workshop (October 15, 2018)
Section titled “West Arden-Arcade Community Workshop (October 15, 2018)”- Prioritize ‘Complete Projects’ for EJ Communities. Remodel streets for transit, pedestrian and bicycle use as well as vehicles. There is a lack of focus on prioritizing money to EJ communities for sidewalks and bike facilities.
- Require permits for off-sale liquor licenses (also require existing businesses to get permits). Place limits on single serving containers. West Arden-Arcade has a high concentration of businesses with off-sale liquor licenses. Areas with high densities of liquor licenses tend to have higher levels of crime.
- Consider making changes to the County Affordable Housing Program and provide incentives for housing (reduced fees, more funding). There is a lack of housing in West Arden-Arcade (affordable, rental and owner).
South Sacramento Community Workshop (October 22, 2018)
Section titled “South Sacramento Community Workshop (October 22, 2018)”- Prioritize ‘Complete Projects’ for EJ Communities. Remodel streets for transit, pedestrian and bicycle use as well as vehicles. There is a high rate of bike and pedestrian collisions in South Sacramento.
- Liquor stores are only a contributing factor and not a root cause of crime. There is a presumption of cause-effect relationship. Job training and business leaders, committees and neighborhood association initiatives to hire/train/educate youth and residents are ways to get to a root cause of crime (unemployment).
- Inclusionary housing ordinance to address the high percentage of housing cost-burdened households (spend more than 30 percent of income toward housing expenses) in South Sacramento.
- Utilize existing community-based organizations as avenues for engagement. Building capacity with existing organizations. Keep the engagement ongoing as a way to keep in contact with the actual community. These comments address the issue that the County does not work well with community organizations.
North Highlands/Foothill Farms Community Workshop (January 22, 2019)
Section titled “North Highlands/Foothill Farms Community Workshop (January 22, 2019)”- Safer bike lanes that are more separated from traffic are needed in North Highlands/Foothill Farms. Heavy and fast traffic on roads make bicyclists feel unsafe.
- Install more sidewalks, street trees and streetlights. North Highlands/Foothill Farms has a shortage of all of these items.
- More support for the establishment and ongoing operations of community gardens and farmer markets. Large areas of the community are food deserts and community gardens and farmer’s markets can address this issue.
- Partner with local community based organizations (CBOs), local churches and business improvement districts to improve public engagement. Involve the community’s youth in public engagement efforts.
- Neighborhood Watch Programs and sex trafficking awareness education programs to address some of the crime issues in North Highlands/Foothill Farms.
Community Workshop held in North Highlands
COMMUNITY MEETINGS
Section titled “COMMUNITY MEETINGS”County staff met with ‘hub’ organizations - organizations that represent numerous organizations in an Environmental Justice Community. On November 12, 2018, staff participated in a workshop held by Sacramento Congregations Together (Sacramento ACT), which is a hub organization for Arden-Arcade. Staff also met with Impact Sacramento Black Child Legacy on December 6, 2018, a hub organization for North Highlands/Foothill Farms, which later became a partner with the County for promoting the January 2019 community workshop in North Highlands. Finally, on December 19, 2018, staff participated in a workshop held by the Stephens Foundation, a hub organization for South Sacramento. The following are key comments received at the Sacramento ACT and Stephens Foundation workshops. See Appendix A-4 for complete list of comments.
Sacramento ACT Workshop (Arden-Arcade) (November 12, 2018)
Section titled “Sacramento ACT Workshop (Arden-Arcade) (November 12, 2018)”- Getting people involved in Arden-Arcade is more challenging than in other communities. People are not as rooted here as they are in other areas (such as Del Paso Heights).
- Arden-Arcade needs an identity and its history needs to be embraced by the community.
- Absentee property owners are a problem in Arden-Arcade. There are apartments that are in shambles and the owners are always looking for reasons to evict.
- Homelessness is a major issue in Arden-Arcade. A challenge is getting the resources to those who need it and the lack of someone to walk the homeless through the steps in getting assistance.
Stephens Foundation Workshop (South Sacramento) (December 19, 2018)
Section titled “Stephens Foundation Workshop (South Sacramento) (December 19, 2018)”- There is a need for home ownership assistance programs and incentives so people will be more invested in their community.
- Access to public facilities is an issue in South Sacramento. There are community centers without children. Some facilities are very expensive to rent.
- The County can provide land development waivers for disadvantaged neighborhoods.
- Farmer’s markets need to be rotated among various sites in South Sacramento and families need to be educated on preparing healthy foods.
Report back sessions were held with each of the ‘hub’ organizations from August through September 2019. Staff presented the draft EJ Element with proposed policies and implementation measures and asked for feedback.
SECTION 2: DEMOGRAPHICS
Section titled “SECTION 2: DEMOGRAPHICS”Sacramento County was incorporated in 1850 and is now home to over 1.5 million people across 994 square miles. The demographic analysis of the EJ Element focuses on total population, population by age, race, ethnicity, languages spoken, English proficiency, and income level.
TOTAL POPULATION
Section titled “TOTAL POPULATION”Table 1: Population by EJ Community
Section titled “Table 1: Population by EJ Community”| EJ Community | Total Population |
|---|---|
| West Arden-Arcade | 16,063 persons |
| South Sacramento | 67,362 persons |
| North Highlands/Foothill Farms | 10,576 persons |
| North Vineyard | 1,733 persons |
Source: US 2010 Census
The most populated EJ Community is South Sacramento while the least populated is North Vineyard (Table 1). This is the result of South Sacramento being mostly developed while North Vineyard being predominately rural agricultural. However, it is likely that within ten years, the population of North Vineyard will increase significantly due to the amount of development targeted for this area.
POPULATION BY AGE
Section titled “POPULATION BY AGE”According to the U.S. 2010 Census, age range population of EJ communities and nonEJ areas are relatively similar (Figure 2). However, South Sacramento and North Highlands/Foothill Farms have a higher percentage of persons under age 20 while nonEJ areas and West Arden-Arcade have a higher percentage of persons over age 60.
Figure 2: Population by Age
Section titled “Figure 2: Population by Age”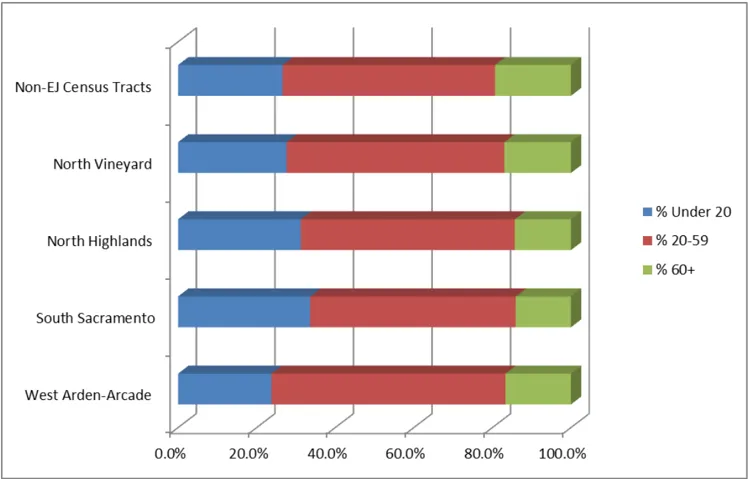
Note: North Highlands includes Foothill Farms and Old Foothill Farms
Source: US 2010 Census
POPULATION BY RACE AND ETHNICITY
Section titled “POPULATION BY RACE AND ETHNICITY”The population of unincorporated Sacramento County has a higher percentage (48%) of White residents than the City of Sacramento (34%) or the State of California (38.8%). Persons of Hispanic-Latino origin are the second largest ethnic population group in the unincorporated County.
Table 2 presents race and ethnicity data for Sacramento County as a whole and for each of the identified EJ communities. The specific racial and ethnic breakdowns differ across these communities.
Table 2: Race and Ethnicity
Section titled “Table 2: Race and Ethnicity”| Race | White | Black | Asian | Hispanic or Latino | Two or More Races | Other |
|---|---|---|---|---|---|---|
| Sacramento County | 48% | 10% | 14% | 22% | 4% | 2% |
| North Highlands/Foothill Farms | 52% | 11% | 6% | 24% | 5% | 2% |
| North Vineyard | 49% | 7% | 2% | 21% | 4% | 17% |
| South Sacramento | 22% | 15% | 23% | 34% | 4% | 2% |
| West Arden-Arcade | 52% | 11% | 6% | 24% | 5% | 2% |
Note: North Highlands includes Foothill Farms and Old Foothill Farms
Source: US 2010 Census
LANGUAGES SPOKEN AND ENGLISH PROFICIENCY
Section titled “LANGUAGES SPOKEN AND ENGLISH PROFICIENCY”The top primary languages in non-EJ Communities are English (78%), Spanish (6.8%) and Russian (2.7%). Of those who speak a language other than English at home, 60 percent report to the U.S. Census that they speak English well. The EJ Communities have the following breakdown by language:
- North Highlands/Foothill Farms: Most common primary languages - English (66.1%), Spanish (16.1%) and Russian (7.0%). Non-English speakers at home who are English proficient - 49.5%.
- West Arden-Arcade: Most common primary languages - English (66.7%), and Spanish (19.6%). Non-English speakers at home who are English proficient 62%.
- South Sacramento: Most common primary languages - English (48.9%), Spanish (24.8%), Hmong (5.8%) and Chinese (4.1%). Non-English speakers at home who are English proficient - 44.2%.
- North Vineyard: Most common primary languages - English (56.1%), Spanish (18.74%), Vietnamese (6.37%). Non-English speakers at home who are English proficient - 45.4%.
South Sacramento is the only community area where a majority of the population does not speak English as their primary language. It also has the most diversity of primary languages.
INCOME LEVELS
Section titled “INCOME LEVELS”According to the U.S. 2010 Census, the median household income for Sacramento County is $55,987, which is higher than the median income of $51,910 for the State of California (Figure 3). Among EJ Communities, median household incomes vary from $34,132 for West Arden-Arcade to $42,917 for North Vineyard. Non-EJ areas have a much higher median income ($67,419) than EJ Communities.
Figure 3: Median Household Income by Area
Section titled “Figure 3: Median Household Income by Area”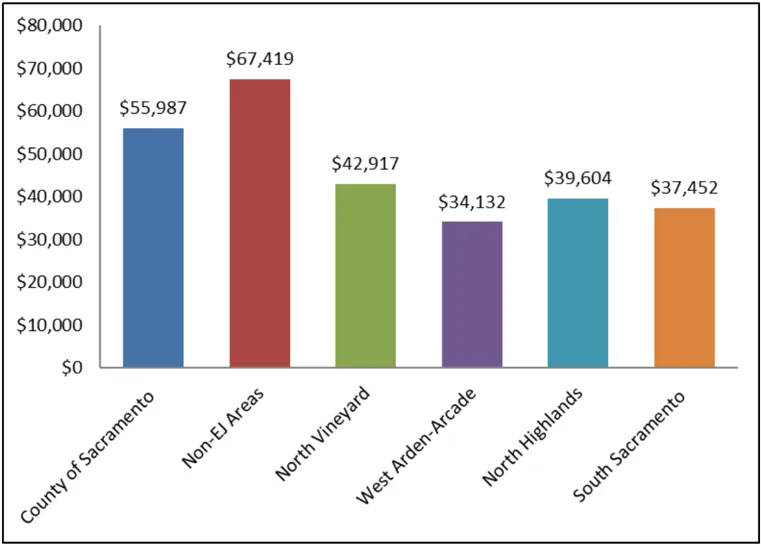
Note: North Highlands includes Foothill Farms and Old Foothill Farms.
Source: US 2010 Census
SECTION 3: PRIORITIZE IMPROVEMENTS AND PROGRAMS THAT ADDRESS THE NEEDS OF ENVIRONMENTAL JUSTICE COMMUNITIES
Section titled “SECTION 3: PRIORITIZE IMPROVEMENTS AND PROGRAMS THAT ADDRESS THE NEEDS OF ENVIRONMENTAL JUSTICE COMMUNITIES”An integral feature of the EJ Element is that it prioritizes projects and investments that directly benefit EJ Communities. EJ Communities have special needs that arise from past geographic and procedural inequities (See Introduction). This requires taking special actions that will improve existing conditions in EJ Communities. Many of these actions will not be applicable across the entire unincorporated County, but will be applicable only to EJ Communities due to their special circumstances.
BASELINE CONDITIONS
Section titled “BASELINE CONDITIONS”The other topical sections identify existing conditions and inequities in EJ Communities, some of which may justify prioritizing certain improvements or programs to one or more EJ Communities.
POLICY AND OBJECTIVES
Section titled “POLICY AND OBJECTIVES”Objective
Section titled “Objective”Prioritize improvements and programs that address the needs of Environmental Justice Communities.
Policy
Section titled “Policy”Improvement and program support for each EJ Community shall address the Community’s unique or compounded needs.
SECTION 4: CIVIL ENGAGEMENT
Section titled “SECTION 4: CIVIL ENGAGEMENT”Civil engagement is an important goal across all local planning and decision-making processes. It can help foster a strong sense of place within a neighborhood and can deepen the investment of stakeholders in working toward neighborhood improvements. Environmental Justice issues will be more effectively identified and resolved if accessible and culturally appropriate opportunities to engage in local decision-making are created for low-income, minority, and linguistically isolated stakeholders. Effective civil engagement not only provides the County with an opportunity to strengthen its relationship with the community, but provides for sound investment in better decision making by ensuring decisions are informed by community needs and aspirations.
Setting up a pop-up booth at a community event is an effective way to engage with people who normally would not attend a public meeting.
BASELINE CONDITIONS
Section titled “BASELINE CONDITIONS”DEMOGRAPHIC CHARACTERISTICS
Section titled “DEMOGRAPHIC CHARACTERISTICS”Existing demographics characteristics in Environmental Justice Communities have implications for public outreach in these communities. For example, according to the U.S. 2010 Census, South Sacramento and North Highlands/Foothill Farms have a higher percentage of persons under age 20 while non-EJ areas and West Arden-Arcade have a higher percentage of persons over age 60. These demographic characteristics will have an influence on how a public engagement program is crafted to reach residents in these communities.
Other demographic characteristics that have an influence on public engagement include race and ethnicity, income levels, languages spoken and English proficiency. The Demographic Section of this Element compares EJ Communities with non-EJ areas for each of these demographic characteristics.
LINGUISTIC ISOLATION
Section titled “LINGUISTIC ISOLATION”Linguistically isolated households are those where no one over the age of 14 has English proficiency. These households are often disadvantaged when trying to attain important information that affects their lives. Adults that lack a command of English may not be able to comprehend health care information that they need or comprehend important directions when there is an emergency. Lacking a command of English may also keep members of a household from participating in public meetings on issues that affect their quality of life. For this reason, the percent of linguistic isolation households in a community often indicate the potential for civil engagement in that community if traditional public engagement methods such as English-only public meetings are used. Communities with high levels of linguistically isolated households have a low potential for civil engagement when only English is used.
Figure 4 shows the percentage of limited English speaking households during 2011 to 2015 in EJ Communities and non-EJ areas. Among the EJ Communities, South Sacramento has the highest percentage (17.4 percent) while West Arden-Arcade has the lowest percentage (6.3 percent). All of the EJ Communities have higher percentages of limited English speaking households than in non-EJ areas (4.6 percent).
Figure 4: Percent Limited English Speaking Households (2011-2015)
Section titled “Figure 4: Percent Limited English Speaking Households (2011-2015)”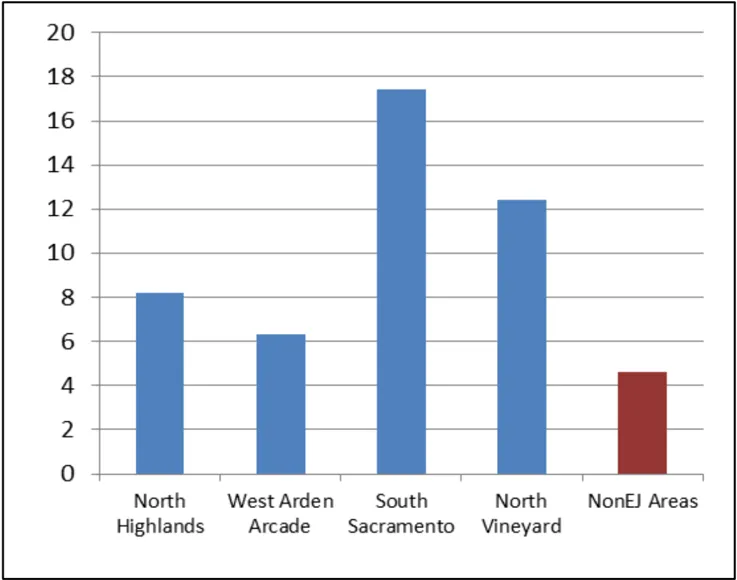
Note: North Highlands includes Foothill Farms and Old Foothill Farms.
Source: Cal Enviroscreen, 2017
LACK OF ORGANIZATIONS TO REPRESENT THE NEIGHBORHOOD OR COMMUNITY
Section titled “LACK OF ORGANIZATIONS TO REPRESENT THE NEIGHBORHOOD OR COMMUNITY”Civil organizations play an important role in the public decision-making process. Individuals in these organizations represent members of the community who cannot or will not attend meetings where decisions are made (often held after a long day at work). Neighborhoods that are disadvantaged often lack representation in the decision-making process, which results in public decisions made without being vested by neighborhood residents. In contrast, the more advantaged neighborhoods are represented by a neighborhood or community association that protects the interests of the neighborhood during the public decision-making process. This results in decisions that are often influenced by neighborhood representatives.
This situation exists in the unincorporated Sacramento County where most neighborhoods in non-EJ areas have representation through a neighborhood or community association while most neighborhoods in EJ Communities lack this representation.
Public meetings should encourage two-way communication so that meeting participants can express their concerns and ideas.
POLICIES AND IMPLEMENTATION MEASURES
Section titled “POLICIES AND IMPLEMENTATION MEASURES”PROMOTING AND ENCOURAGING CIVIL ENGAGEMENT
Section titled “PROMOTING AND ENCOURAGING CIVIL ENGAGEMENT”Objective
Section titled “Objective”To create accessible and culturally appropriate opportunities for all people regardless of race, color, national origin, or income to engage in the decision making process.
Intent
Section titled “Intent”The intent of the objective and policies that follow are to ensure appropriate opportunities are in place for all persons to participate in the decision making process. During public outreach for the Environmental Justice Element, the public informed the County that they felt unheard during past civic engagement opportunities and/or were unaware of opportunities for civil engagement. Therefore, it is the intent of the County to evaluate the current process and improve the process. The implementation measure is the County’s assurance to develop a strategy in creating meaningful communication opportunities.
In alignment with this objective of culturally appropriate civic engagement opportunities, it is imperative to incorporate tribal knowledge into CEQA review and decision-making process as required by State law (AB-52 and SB-18). AB-52 enables a California tribe to request consultation with a local government for any proposed project that is subject to CEQA and located in an area that is culturally affiliated with the tribe. SB-18 is similar to AB-52 but requires local governments to notify appropriate tribal representatives of a consultation opportunity prior to the amendment or adoption of General or Specific Plans. The local government also refers the project site to a regional office of the California Historical Resources Information System to determine whether there is a high probability that historic resources are within the project site. If so, the local government requires the project applicant to hire an archeologist to do a cultural resources survey of the project site.
The County recognizes the unique and important roles that both California Native American tribal representatives and qualified archaeologists have in project review and analysis. The County, a lead agency during tribal consultation, will consider the tribal representatives as experts concerning tribal resources and archaeologists as experts in the field of archaeology.
Policies (Countywide)
Section titled “Policies (Countywide)”The County supports an equitable and comprehensive approach to civic engagement and public outreach on all aspects of County governance and delivery of services.
Sacramento County acknowledges the distinction and significance of archaeological resources and tribal cultural resources. Sacramento County recognizes the expertise of both qualified professional archaeologists and California Native American Tribal representatives who may have knowledge regarding tribal cultural resources.
Implementation Measures (Countywide)
Section titled “Implementation Measures (Countywide)”- The County of Sacramento will create a comprehensive Community Outreach Strategy that serves as a framework for all departments to participate in meaningful two-way communication with the public on all aspects of County governance and delivery of services. (PUBLIC INFORMATION OFFICE, PLANNING AND ENVIRONMENTAL REVIEW WITH SUPPORT FROM ALL OPERATING DEPARTMENTS)
SECTION 5: CRIME PREVENTION
Section titled “SECTION 5: CRIME PREVENTION”The fear of crime at the neighborhood level and the crime activity that leads to this fear is an issue that must be dealt with if many of the Environmental Justice objectives listed in this Element are to be attained. For example, the fear of crime could discourage residents from using parks or bike trails and thus makes it more difficult for residents to reach a healthy level of physical activity as encouraged by the objectives and policies in the Physical Activity Section. The fear of crime could also discourage residents from developing community gardens, which would prevent increasing access to fresh fruits and vegetables as encouraged by the objectives and policies in the Healthy Food Access Section.
Techniques that can reduce crime activity and the fear resulting from this activity for the short term include Crime Prevention Through Environmental Design (CPTED) and regulating potentially problematic land uses (such as liquor and convenience stores). A long-term strategy in reducing criminal activity is to support youth programs and job development in Environmental Justice Communities.
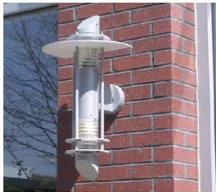
Adequate outdoor walkway lighting is an important feature in maximizing people’s ability to be aware of their environment after daylight
BASELINE CONDITIONS
Section titled “BASELINE CONDITIONS”VIOLENT CRIME AND PROPERTY CRIME RATES
Section titled “VIOLENT CRIME AND PROPERTY CRIME RATES”Table 3 show the violent crime and property crime rates per 1,000 residents during 2016 for geographic areas that include Environmental Justice Communities. The table also shows the rates for the combined Sacramento County Sheriff’s (SCS) and Sacramento City Police Department (CPD) service areas.
Each of the geographic areas in Table 3 had higher rates of violent crimes than the combined SCS and CPD service areas. Fruitridge/Stockton Boulevard (includes a large portion of the South Sacramento EJ Community) had a violent crime rate that was over 60 percent over the SCS/CPD combined service areas. Arden-Arcade (includes the West Arden-Arcade EJ Community) and North Highlands/Foothill Farms had violent crime rates that were over 12 and 18 percent over the SCS/CPD combined service areas respectively.
For property crimes (Table 4), only Arden-Arcade had a higher rate of property crimes (25 percent higher) than the SCS/CPD combined service areas. North Highlands/Foothill Farms and Fruitridge/Stockton Boulevard had property crime rates that were about 13 percent lower than the SCS/CPD combined service areas.
Table 3: Violent Crime Rates per 1,000 Residents
Section titled “Table 3: Violent Crime Rates per 1,000 Residents”| Geographic Area That Includes EJ Community | Rate Per 1000 Residents | Percent Over SCS and CPD Service Area |
|---|---|---|
| Arden-Arcade (1) | 3.7 | 12.12% |
| North Highlands/Foothill Farms (2) | 3.9 | 18.18% |
| Fruitridge/Stockton Boulevard (3) | 5.3 | 60.61% |
| Total Sacramento County Sheriff’s (SCS) and City Police Department (CPD) Service Area | 3.3 | NA |
- Arden-Arcade includes West Arden-Arcade EJ Community and portion of Arden-Arcade east of Watt Avenue.
- North Highlands/Foothill Farms consistent with North Highlands/Foothill Farms EJ Community boundaries.
- Fruitridge/Stockton Boulevard includes South Sacramento EJ Community south of 47th Avenue and portions of City of Sacramento (Parkway, Valley Hi)
Source: LPC Consulting Associates, Inc. for Black Child Legacy, 2018
Table 4: Property Crime Rates per 1,000 Residents
Section titled “Table 4: Property Crime Rates per 1,000 Residents”| Geographic Area That Includes EJ Community | Rate Per 1000 Residents | Percent Over SCS and CPD Service Area |
|---|---|---|
| Arden-Arcade (1) | 32.5 | 25.00% |
| North Highlands/Foothill Farms (2) | 22.6 | -13.08% |
| Fruitridge/Stockton Boulevard (3) | 22.5 | -13.46% |
| Total Sacramento County Sheriff’s (SCS) and City Police Department (CPD) Service Area | 26 | NA |
Notes same as Table 3
Source: LPC Consulting Associates, Inc. for Black Child Legacy, 2018
CONVENIENCE STORES AND LIQUOR STORES
Section titled “CONVENIENCE STORES AND LIQUOR STORES”The location and density of potential crime-attracting land uses such as convenience stores and liquor stores were identified in EJ Communities and non-EJ areas. Figure 5 shows the number of convenience stores and liquor stores that have off-sale liquor licenses (License Types 20 and 21) per 1,000 residences in each of the EJ Communities and in non-EJ areas. According to Figure 5, EJ Communities have a much higher number of these business types per 1,000 residences than non-EJ areas.
Figure 5: Convenience Stores and Liquor Stores per 1,000 Residences
Section titled “Figure 5: Convenience Stores and Liquor Stores per 1,000 Residences”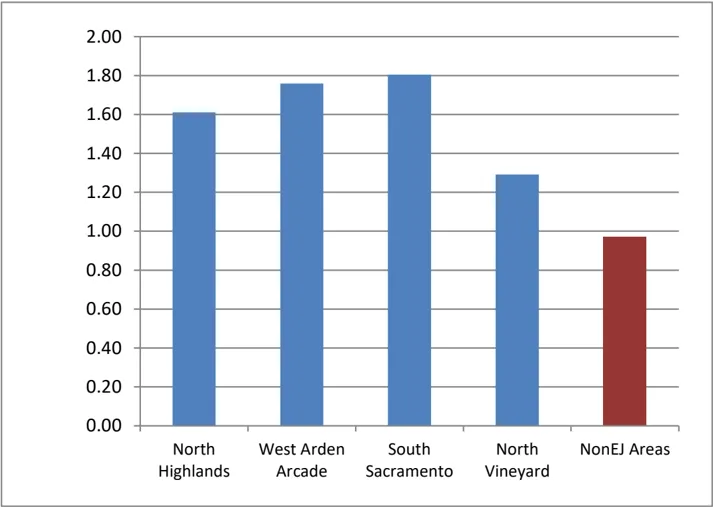
Note: North Highlands includes Foothill Farms and Old Foothill Farms
Source: County of Sacramento Sheriff’s Department, 2018
POLICIES AND IMPLEMENTATION MEASURES
Section titled “POLICIES AND IMPLEMENTATION MEASURES”CRIME PREVENTION THROUGH ENVIRONMENTAL DESIGN
Section titled “CRIME PREVENTION THROUGH ENVIRONMENTAL DESIGN”Objective
Section titled “Objective”Broaden community involvement in crime prevention by incorporating visibility and other issues of public safety in neighborhood and building design.
Intent
Section titled “Intent”Crime Prevention through Environmental Design (CPTED) uses the built environment to reduce both the incidence and fear of crime with the objective of not displacing crime to another community but deterring crime. This is achieved through the proper design, maintenance and use of the buildings and the spaces between buildings. The following are the major principles of CPTED:
- Natural Surveillance: Maximizes people’s ability to be aware of their environment while doing their normal activity.
- Territoriality: Clearly delineates between the public, private and semi-public realms in the built environment. This delineation makes it easier for people to use an area in a way that is consistent with its purpose.
- Access Control: Prevents access to those who will commit illegal acts, especially access to an area where it would be easy to conceal an illegal act.
- Management and Maintenance: Without proper maintenance of landscaping, lighting and other features, even the best CPTED design elements will ultimately fail (City of Portland, OR 2015).
Policy (Countywide)
Section titled “Policy (Countywide)”The County will advance residential subdivision and commercial building design that supports crime prevention by utilizing Crime Prevention through Environmental Design (CPTED) principles.
Implementation Measures (Countywide)
Section titled “Implementation Measures (Countywide)”- The County will incorporate reducing crime through environmental design (CPTED) measures into the County's Zoning Code, Design Review Guidelines and Building Code to discourage crime, and encourage compatible uses. (PLANNING AND ENVIRONMENTAL REVIEW, SHERIFF'S DEPARTMENT)
- The County will prepare a 'security ordinance' which will be a uniform code that will provide minimum safety and security specifications for new residential and commercial developments such as minimum specifications for door thickness, lock construction, and lighting. (SHERIFF'S DEPARTMENT, PLANNING AND ENVIRONMENTAL REVIEW)
- The Office of Planning and Environmental Review will ensure that CPTED training and certification is made available to staff. (PLANNING AND ENVIRONMENTAL REVIEW)
- The County will continue to have a representative from the Sheriff's Department to comment on development plans during the Plan Review Committee (PRC) process. (SHERIFF'S DEPARTMENT)
- The Office of Planning and Environmental Review (PER) and the Sheriff's Department will consider developing a Crime Prevention through Environmental Design (CPTED) assessment program that will be available to business owners and commercial building owners at no cost. The assessment could be supported by a small business license surcharge. For buildings located in Environmental Justice Communities, building permit and site improvement fees should be reduced for CPTED improvements that are responses to a CPTED assessment. The program will be advertised by PER through Property Improvement Business Districts and Chambers of Commerce. (PLANNING AND ENVIRONMENTAL REVIEW, SHERIFF'S DEPARTMENT)
Implementation Measures (EJ Communities)
Section titled “Implementation Measures (EJ Communities)”- Prioritize street lighting programs for Environmental Justice Communities particularly at parks and transit stops and along commercial corridors and in high crime neighborhoods. Focus on pedestrian-scale rather than vehicularscale lighting. (TRANSPORTATION)
Many robberies occur as people walk to or from their cars in parking lots.
PROBLEMATIC LAND USES
Section titled “PROBLEMATIC LAND USES”Objective
Section titled “Objective”Limit the number and density of problematic land uses in order to conserve the quality of commercial districts and residential neighborhoods.
Intent
Section titled “Intent”Some land uses tend to have more crime occurring within their vicinity than other uses. Generally, commercial areas tend to have more crime than low-density residential areas or mixed-use areas. More specifically, high density of alcohol outlets in low income areas are associated with higher rates of violent crime as shown in a number of studies (Scribner et al, 1995; Gruenewald et al, 2006; Roman et al, 2008). That is, more assaults, domestic violence and other violent crimes occur when there are bars, liquor stores, and other alcohol-selling places clustered together in low-income areas.
Two factors probably contribute to the above situation. The first factor is that these businesses create a perception of social disorder - broken bottles littered around a liquor store and a parking lot full of cars with people drinking alcohol gives the impression that the normal rules about orderly behavior are not enforced (Stewart). The second factor is that a high density of alcohol outlets attracts individuals who are more inclined to be violent while at the same time attracts individuals who are more vulnerable to being assaulted. Besides causing more violent crime, studies have shown that a high density of alcohol outlets contributes to other alcohol-related problems such as drinking and driving, higher rates of pedestrian injuries caused by vehicles, and child abuse and neglect (Stewart). Since studies show that the density of alcohol outlets is positively correlated with higher crime levels, the County will consider Zoning Code amendments that will require use permits for all off sales of liquor licenses (License Types 20 and 21) and will consider distance requirements (from residential, sensitive uses and like uses) for convenience stores and liquor stores.
Requiring a use permit for convenience and liquor stores will allow County staff and hearing bodies to thoroughly evaluate an individual request for neighborhood compatibility. Requiring a use permit will also enable the County, including the Sheriff’s Department the ability to place reasonable conditions of approval on the project, such as prohibiting sales of single containers and restricting hours of sales. It should be noted that the County would be responsible for enforcing conditions on the use permit.
In addition, existing convenience and liquor stores without a use permit would need to obtain a Nonconforming Use (NCS) permit during a pre-determined period. For the NCS permit, the Sheriff’s Department could place the same restrictions as those placed on Use Permits for new businesses. It is anticipated that findings cannot be made to approve the use permit or NCS permit for some new or existing businesses and thus some existing businesses would have to cease operating.
A second approach is to refine the County’s process for Public Convenience/Necessity (PCN) letters for off-sale liquor licenses in a way that addresses any nuisance or criminal impacts. Applicants for liquor licenses need to obtain a PCN letter from the County when the sales location is within a census tract designated by the State Alcoholic Beverage Control Board (ABC) as over-concentrated with liquor licenses or within a neighborhood determined by the Sheriff’s Department to be a high crime area. Since most census tracts in EJ Communities meet these criteria, a liquor license applicant would most likely need a PCN letter from the County for liquor sales in an EJ Community and enhanced conditioning could be used to address each community’s specific unique and/or compounded needs.
Policy (EJ Communities)
Section titled “Policy (EJ Communities)”The County will control uses requiring liquor licenses (particularly off-sale licenses) in Environmental Justice Communities where there is already an overconcentration of liquor licenses to reduce or eliminate nuisance or criminal impacts, particularly those that are leading to unique or compounded health effects on the community.
Implementation Measures (EJ Communities)
Section titled “Implementation Measures (EJ Communities)”- Option 1: Explore amending the Zoning Code to require use permits for liquor stores, and convenience stores that have an off-sale alcoholic license, and to explore whether or not to include liquor and convenience stores for consideration in the County's distance separation and overconcentration requirements for certain uses. (PLANNING AND ENVIRONMENTAL REVIEW)
- Option 2: Refine the County's process for Public Convenience/Necessity (PCN) letters for off-sale liquor licenses in a way that addresses any nuisance or criminal impacts. (PLANNING AND ENVIRONMENTAL REVIEW)
- Option 3: In consultation with residents, businesses, the Sherriff's Department, County Public Health, and other subject matter experts, the County will explore an amendment to the County Code for the purpose of establishing a Special Business License for convenience markets. The purpose is to regulate the nuisance, criminal, and health-related impacts associated with convenience uses, particularly where overconcentration of such uses occur.
Or
Or
SUPPORTING YOUTH ACTIVITIES IN ENVIRONMENTAL JUSTICE COMMUNITIES
Section titled “SUPPORTING YOUTH ACTIVITIES IN ENVIRONMENTAL JUSTICE COMMUNITIES”Objective
Section titled “Objective”Environmental Justice Communities will have thriving youth programs that will involve the community’s youth.
Intent
Section titled “Intent”It is widely known that effective youth programs (serving children up through age 18) in disadvantaged areas have many benefits for participants, their family and their community. Documented benefits for participants include improvement in academic performance, improvement in classroom behavior, reduced drug use, increased physical fitness and better dietary habits. Parents directly benefit by having a trusted caretaker for their children while they are at work. Communities benefit by having reduced rates of crime and drug use when there are successful youth programs in the community (Youth.Gov).
Supporting youth programs in Environmental Justice Communities is a long-term strategy in reducing or eliminating crime in these communities. If youth are involved in positive activities, they will be less susceptible to participate in criminal or drug activity when they become older.
Policy (EJ Communities)
Section titled “Policy (EJ Communities)”Support youth programs in Environmental Justice Communities to encourage the healthy development of youth and their transition to adulthood.
Implementation Measures (EJ Communities)
Section titled “Implementation Measures (EJ Communities)”- Consider the development of Youth Master Plans for each community in the unincorporated County, starting with the Environmental Justice Communities. These plans will provide a vision and a roadmap to improve and enhance the overall quality of life for the community's children, youth and families. The Youth Master Plan will include the creation of an information sharing and support network to assist youth to make connections with County decision makers and elected officials. The Sacramento County Youth Council will have an important role in this effort. (DEPARTMENT OF HEALTH SERVICES)
- Reduce or eliminate fees for temporary use permits for events sponsored by children or youth programs and are located in Environmental Justice Communities. (PLANNING AND ENVIRONMENTAL REVIEW)
INCREASE JOB OPPORTUNITIES IN ENVIRONMENTAL JUSTICE COMMUNITIES
Section titled “INCREASE JOB OPPORTUNITIES IN ENVIRONMENTAL JUSTICE COMMUNITIES”Objective
Section titled “Objective”Job-seeking residents in Environmental Justice Communities can find jobs that lead to financial self-sufficiency.
Intent
Section titled “Intent”A community benefits in multiple ways when community members have jobs that pay living wages and are able to work in clean and safe workplaces. Having a job that pays living wages enables one to attain financial self-sufficiency. When financial selfsufficiency is attained, more community members experience better health, improved nutrition and lower death rates. Financial self-sufficiency also leads to reduced crime activity, particularly property crime activity. Multiple studies have found that an increase in the unemployment rate increases the rate of property crimes. (Altingdag, 2011; Lin, 2008; Raphael et al, 2001). Thus, another long-term strategy to prevent crime in Environmental Justice communities is to provide more economic opportunities in these communities.
Policies (EJ Communities)
Section titled “Policies (EJ Communities)”Market assets of Environmental Justice Communities to attract employers to locate their businesses in these communities.
Support and enhance job-skills training, workforce housing and recruitment programs and services in Environmental Justice Communities.
Support business improvement districts in Environmental Justice Communities to increase job opportunities and reduce violence and crime in affected neighborhoods.
EJ-10.
Section titled “EJ-10.”Support locating County employment centers and facilities in Environmental Justice Communities and providing County paid-internship and volunteer opportunities for residents in Environmental Justice Communities.
EJ-11.
Section titled “EJ-11.”Encourage the provision of wireless communications services throughout Environmental Justice Communities at a level greater than the minimum required by the Telecommunications Act for improved business development, access to information, and public safety.
Implementation Measures (EJ Communities)
Section titled “Implementation Measures (EJ Communities)”- The County will incorporate economic development, multimodal transportation, and affordable housing strategies into neighborhood strategic plans, community plans or other strategic planning documents when they are prepared or updated for the Environmental Justice Communities. (PLANNING AND ENVIRONMENTAL REVIEW)
- The County will consider residency in an Environmental Justice Community as a positive factor in selecting candidates for County internships. (ALL COUNTY AGENCIES)
- Continue to provide assistance to community and neighborhood organizations in their efforts to provide job training, employment and workforce housing opportunities in Environmental Justice Communities. (PLANNING AND ENVIRONMENTAL REVIEW)
SECTION 6: HEALTHY FOOD ACCESS
Section titled “SECTION 6: HEALTHY FOOD ACCESS”Food plays a critical role in the health, economy and culture of a sustainable community. Therefore, it is essential that all stakeholders have access to food that is healthy, affordable and culturally appropriate. Environmental Justice Communities may face constraints related to accessibility to nutritional food; this lack of accessibility has a direct impact on personal health and well-being. Food access is not only linked to the physical accessibility of affordable and culturally appropriate food, but also to food security, defined as access by all people at all times to enough food for an active, healthy life. Food security includes the availability of nutritionally adequate and safe foods as well as the ability to acquire foods in socially acceptable ways (without resorting to emergency food supplies, scavenging, stealing, or other coping strategies) (Anderson, 1990).
BASELINE CONDITIONS
Section titled “BASELINE CONDITIONS”FOOD ACCESS
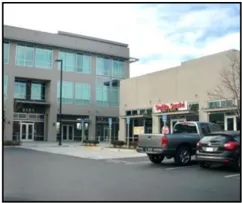
Section titled “FOOD ACCESS”According to grocery store data from the Sacramento Area Council of Governments (SACOG), there are a higher percentage of residential units within the North Highlands/Foothill Farms, West Arden-Arcade, and South Sacramento EJ Communities that are within half a mile of grocery stores than within non-EJ areas (Table 5). This trend is especially notable in the South Sacramento EJ Community where there are a large number of small ethnic markets. However, comments received during public outreach for the EJ Element assert that there are still food deserts existing in EJ Communities at the neighborhood scale. Figure 6 and Figure 7 identify grocery store locations in comparison to residential areas and other food-related uses.
Access to healthy, fresh food is necessary for a sustainable community.
Photo by Joe Szurszewski (CC BY-NC 4.0). Copyright 2015 American Planning Association.
Table 5: Percentage of Residences within ½ Mile of Grocery Store
Section titled “Table 5: Percentage of Residences within ½ Mile of Grocery Store”| Community | Number of Units | Number of Units within 1/2 mile of Grocery Store | Percentage of Units within ½ Mile of Grocery Store |
|---|---|---|---|
| North Vineyard | 1548 | 0 | 0% |
| North Highlands/Foothill Farms | 25,456 | 15,965 | 63% |
| West Arden-Arcade | 20,464 | 10,838 | 53% |
| South Sacramento | 28,807 | 17,309 | 60% |
| Non- EJ Area | 130,477 | 39,836 | 31% |
Source: Sacramento County Office of Planning and Environmental Review, 2017
Figure 6: Healthy Food Access in North Highlands/Foothill Farms and West Arden-Arcade
Section titled “Figure 6: Healthy Food Access in North Highlands/Foothill Farms and West Arden-Arcade”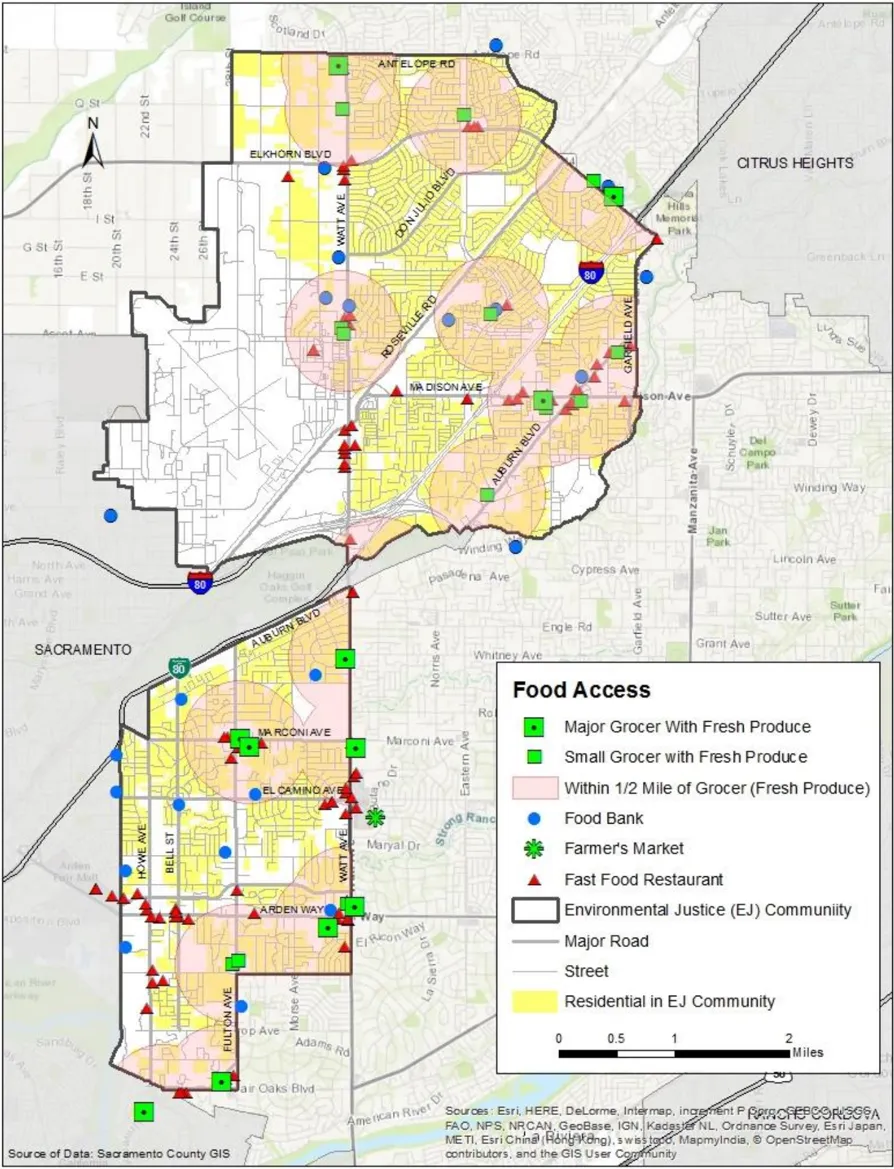
Source: Sacramento County Planning and Environmental Review, 2017
Figure 7: Healthy Food Access in South Sacramento
Section titled “Figure 7: Healthy Food Access in South Sacramento”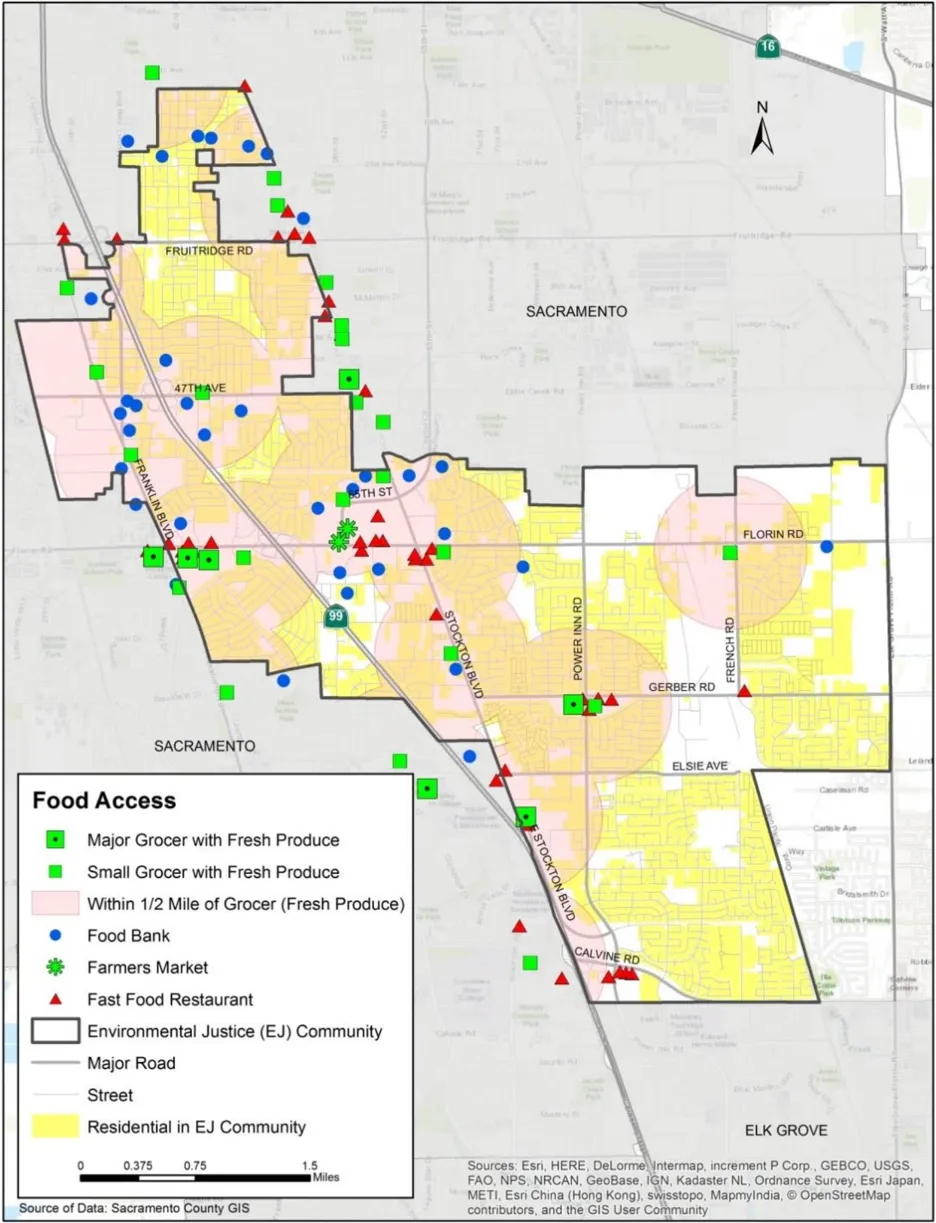
Source: Sacramento County Planning and Environmental Review, 2017
FOOD INSECURITY
Section titled “FOOD INSECURITY”Though access to grocery stores in EJ Communities is generally higher than in non-EJ areas at the community scale, EJ Communities have a problem with food insecurity. Food insecurity is the limited or uncertain availability of nutritionally adequate and safe foods or limited or uncertain ability to acquire acceptable foods in socially acceptable ways. Feeding America conducts an annual study to estimate the number of food insecure people and the percentage of the population that experienced food insecurity at some point during a given year. According to their estimates, both the food insecurity rates and the food insecurity population are significantly higher in West Arden-Arcade, North Highlands/Foothill Farms, and South Sacramento EJ communities than in non-EJ areas (Figure 8). Of the County-wide food-insecure population, Feeding America found that the income of the majority of households which were considered food insecure were actually above the Federal poverty level used for nutrition programs like the Supplemental Nutrition Assistance Program (SNAP) and the Women, Infants, and Children program (WIC) and would not be eligible for assistance. Households, which earn too much to qualify for Federal nutrition assistance programs but are still food insecure, must choose between competing priorities such as housing, utilities and medical expenses.
The North Vineyard EJ Community serves as the contradiction to the baseline data conditions above. As a rural community which has been targeted for new growth, this community is estimated to have a food insecurity rate that is similar to that of non-EJ areas.
Figure 8: Food Insecurity Rates
Section titled “Figure 8: Food Insecurity Rates”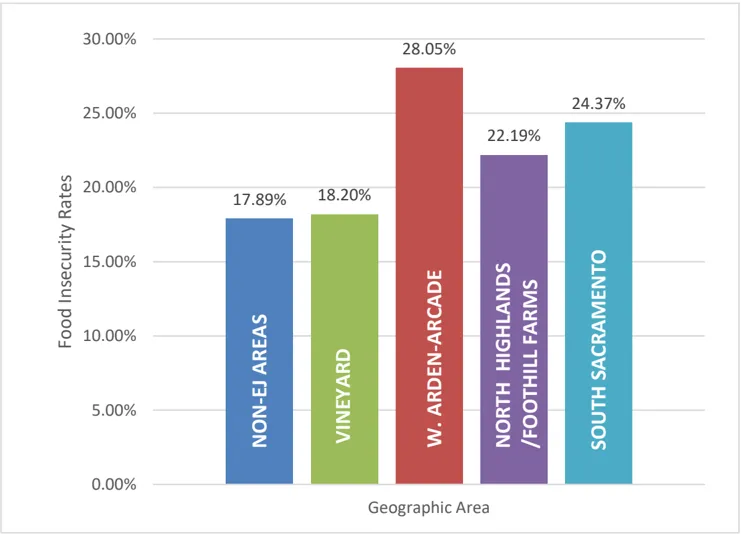
Source: Feeding America, 2017
POLICIES AND IMPLEMENTATION MEASURES
Section titled “POLICIES AND IMPLEMENTATION MEASURES”COUNTYWIDE FOOD ACTION PLAN
Section titled “COUNTYWIDE FOOD ACTION PLAN”Objective
Section titled “Objective”Improve the food system in the Sacramento area so that all area residents have access to healthy foods.
Intent
Section titled “Intent”The policy and implementation measures below relate to the creation of a Countywide Food Action Plan, which will create a holistic vision for the food system from production through waste management County-wide. The Food Action Plan will outline the County’s goals in support of an equitable and healthy food system that goes beyond the land use goals of the General Plan.
Policy (Countywide)
Section titled “Policy (Countywide)”EJ-12.
Section titled “EJ-12.”The County supports an equitable and comprehensive approach to food systems from production through processing, distribution, access and waste management in a way that supports the health, environment, equity, and economy of the region.
Implementation Measures (Countywide)
Section titled “Implementation Measures (Countywide)”- Develop a Food System Assessment to assess baseline conditions of the County's current food system within two years of adoption of the Phase 2 Environmental Justice Element in order to inform the preparation of a Countywide Food Action Plan. (DEPARTMENT OF HEALTH SERVICES)
- Develop a Countywide Food Action Plan for approval by the Board of Supervisors within two years of completion of the Food System Assessment. (DEPARTMENT OF HEALTH SERVICES)
- Invite and encourage all incorporated cities to participate in preparation of the Food Action Plan. (DEPARTMENT OF HEALTH SERVICES)
- Establish a Countywide team with representatives from the following to include, but not limited to: Department of Health Services, Office of Planning and Environmental Review, Department of Human Assistance, Office of Education, Environmental Management Department, Department of Waste Management and Recycling, Office of Economic Development, SACDOT, Regional Parks, SACOG and representatives from the incorporated cities, and community stakeholders, and advocates to assist in the preparation of the Food System Assessment and the Food Action Plan. (DEPARTMENT OF HEALTH SERVICES)
- Work with the Countywide team to research and implement a permanent funding option for a Healthy Food Fund that would fund implementation of activities identified in the Food Action Plan. (DEPARTMENT OF HEALTH SERVICES)
- Evaluate the Food Action Plan every 5 years and provide an update on the progress of implementation and a reassessment of goals to the Board of Supervisors. (DEPARTMENT OF HEALTH SERVICES)
- Create and maintain a webpage containing information about the Food Action Plan and other County-initiated efforts related to food access and food equity. (DEPARTMENT OF HEALTH SERVICES).
Farmer’s markets can provide affordable fresh produce in areas that lack grocery stores and provide customers for local farmers.
Photo by Kelly Wilson (CC BY-NC 4.0). Copyright 2015 American Planning Association.
INCREASING HEALTHY FOOD ACCESS
Section titled “INCREASING HEALTHY FOOD ACCESS”Objective
Section titled “Objective”Reduce by 50 percent the food insecurity rates in the unincorporated Sacramento County.
Intent
Section titled “Intent”Environmental Justice Communities may face constraints related to accessibility to nutritional food; this lack of accessibility has a direct impact on personal health and well-being. Food access is not only linked to the physical accessibility of affordable food but also to food security, defined as access by all people at all times to enough food for an active, healthy life. The policies and implementation measures below are aimed at improving access to healthy food products. A healthy food product is defined as a raw, canned, or frozen fruit or vegetable which contains limited total fat, limited saturated fat, and limited cholesterol, or it is a product which contains limited total fat, limited saturated fat, and limited cholesterol and which provides at least 10 percent of the reference daily intake (RDI) or the daily reference value (RDV) of one or more of the following: vitamins A or C, iron, calcium, protein, or fiber consistent with the Code of Federal Regulations Title 21, Volume 2 Section 101.65(d)(2).
Policies (Countywide)
Section titled “Policies (Countywide)”EJ-13.
Section titled “EJ-13.”The County will encourage the provision of safe, convenient opportunities to access healthy food products by ensuring that sources of healthy foods are accessible to neighborhoods. In urbanized communities, access should be within a quarter-mile of public transit.
EJ-14.
Section titled “EJ-14.”The County recognizes the importance of education for healthy food choices. The County will support youth food education programs and promote public service announcements and messaging about healthy eating habits, food choices, nutrition, and related County programs.
EJ-15.
Section titled “EJ-15.”The County recognizes that access to healthy food includes the ability to access economic development opportunities. The County will support development of food system employment training opportunities, such as food business incubator projects.
Implementation Measures (Countywide)
Section titled “Implementation Measures (Countywide)”- Develop a definition of healthy food products and require convenience stores to dedicate a certain percentage of shelf space to the sale or display of healthy food products. This process may be accomplished via Zoning Code Amendment, County Code Amendment, or other regulation. The required shelf space percentage shall be informed by market studies or Countywide Food Action Plan to ensure the requirement meets the need yet does not result in waste from unsold food. (PLANNING AND ENVIRONMENTAL REVIEW)
- Amend the Zoning Code to include market gardens and/or edible landscaping as common outdoor amenities and open space in the Multifamily Residential Development Standards. (PLANNING AND ENVIRONMENTAL REVIEW)
- Establish a Technical Advisory Committee including grocers and communitybased organizations in order to understand and reduce barriers to grocery store development in Environmental Justice Communities. (PLANNING AND ENVIRONMENTAL REVIEW)
- Promote CalFresh, Market Match, Senior Farmers Market Nutrition Program, and the Woman, Children & Infants Farmers' Market Nutrition Program to all farmers' markets managers. (AGRICULTURE COMMISSIONER)
- Provide CalFresh, Market Match, Senior Farmers Market Nutrition Program, and Woman, Children & Infants Program recipients with information on Famers Markets, which accept program coupons. (DEPARTMENT OF HUMAN ASSISTANCE)
- The County through the Offices of Planning and Environmental Review and Economic Development will increase opportunities for locating providers of fresh produce (grocery stores, farmer markets, produce stands) near existing neighborhoods, particularly low-income neighborhoods, and in new master plan areas. (PLANNING AND ENVIRONMENTAL REVIEW, ECONOMIC DEVELOPMENT)
SECTION 7: PHYSICAL ACTIVITY
Section titled “SECTION 7: PHYSICAL ACTIVITY”Physical activity is a large contributor to the physical and mental health of Sacramento County residents. Physically active people tend to live longer and have lower risk for heart disease, stroke, type 2 diabetes, depression, and some cancers (Center for Disease Control and Prevention, 2017). People partake in physical activity for many different reasons. Some are physically active for recreational purposes, such as taking the dog for a walk after dinner, going for a run, or playing basketball in the neighborhood park, while others are physically active for transportation purposes, such as commuting by bike or walking to a local restaurant or store. Physical activity is promoted by the built environment through providing places that encourage walking, biking and other forms of exercise. These places include parks, open space, trails, urban green spaces, groves with robust tree canopies, and active transportation networks. For example, if a community has a network of safe bike trails, community members are more likely to bike within that community.
BASELINE CONDITIONS
Section titled “BASELINE CONDITIONS”OBESITY RATES
Section titled “OBESITY RATES”Obesity is a serious health issue and personal involvement in physical activity is one way to prevent obesity. Data on obesity in the County is limited. Sacramento County’s Department of Health Services (Health Services) initially had data for a few census tracks within the County including the West Arden-Arcade and South Sacramento Environmental Justice communities. Health Services later provided data for North Highlands/Foothill Farms but data for North Vineyard is still not available. Figure 9 identifies obesity rates for the communities where data is available.
Figure 9: Percentage of Obese Individuals
Section titled “Figure 9: Percentage of Obese Individuals”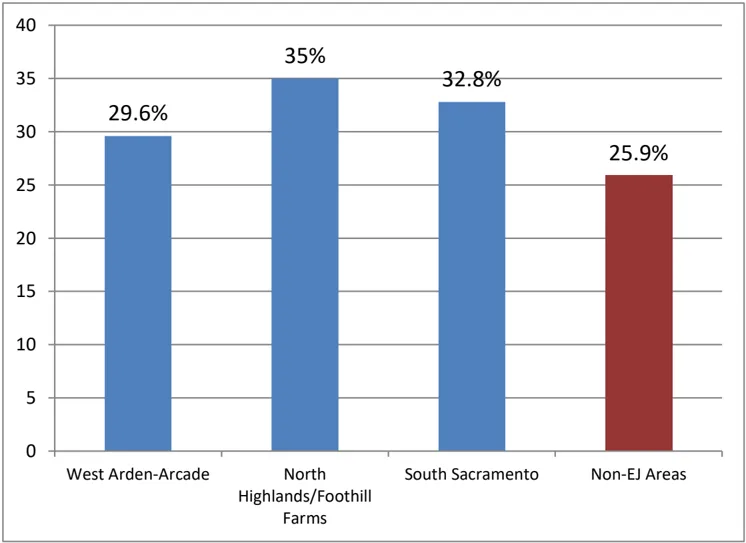
Source: Sacramento County Department of Health Services, 2017, 2018
California has the fifth lowest adult obesity rate in the United States, with 25 percent of adults being obese in 2016 (Trust for America’s Health, 2017). Based on the limited data available, we can see in Figure 9 that the non-EJ areas obesity percentage is close to the California average but the percentages for West Arden-Arcade, North Highlands/Foothill Farms and South Sacramento are all above the state average.
The Center for Disease Control and Prevention, (2017) reports that adults with more education and whose family income is above the poverty level are more likely to engage in more aerobic activity than adults with less education or whose family income is at or near the poverty level Center for Disease Control and Prevention, (2017).
Photo by Joe Szurszewski (CC BY-NC 4.0). Copyright 2017 American Planning Association.
BIKE TRAILS AND LANES
Section titled “BIKE TRAILS AND LANES”To encourage bicycle activity, a city or county must provide an adequate amount of bicycle lanes/trails that provide access to desired destinations. Sacramento County has a comprehensive inventory of Class I (off-road) and Class II (on-road) bike lanes. Figure 10 shows the number of miles of Class I and Class II bike lanes per 1,000 dwelling units as of 2017.
For Class I bike trails, the amount of bike trail miles per 1,000 residences in EJ Communities is less than half of that in non-EJ areas. EJ Communities (except for North Vineyard) are in older developed areas where the amount of open space is limited. Non-EJ areas include parkways (such as the American River Parkway) and other open space areas that make it feasible to establish long segments of off-road bike trails. For Class II bike lanes, the amount of bike lane miles per 1,000 residences in the South Sacramento and North Highlands/Foothill Farms EJ communities are comparable to that in non-EJ areas. However, the amount of bike trails per 1,000 residences in West Arden-Arcade is much less than in non-EJ areas.
Neighborhoods with active design treatments, such as sidewalks and shade trees, generate about 120 percent more pedestrian and bicycle trips than automobile oriented neighborhoods
Photo by Greg Griffin, AICP (CC BY-NC 4.0). Copyright 2016 American Planning Association.
Figure 10: Class I and II Bike Lanes Per 1,000 Residences (2017)
Section titled “Figure 10: Class I and II Bike Lanes Per 1,000 Residences (2017)”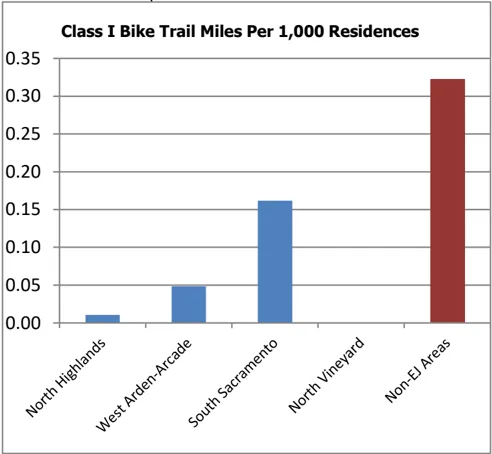
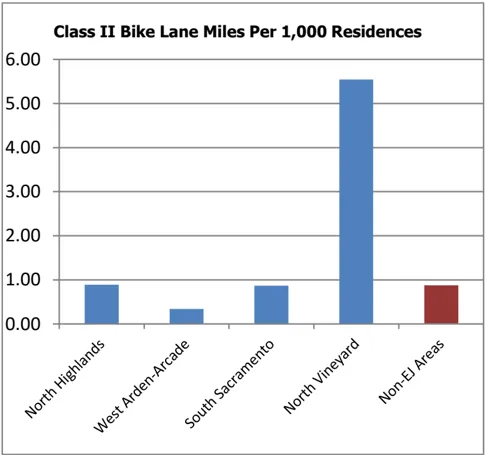
Note: North Highlands also includes Foothill Farms/Old Foothill Farms.
Source: Sacramento Area Council of Governments, 2017.
BIKE AND PEDESTRIAN COLLISIONS
Section titled “BIKE AND PEDESTRIAN COLLISIONS”Besides providing bike lanes and sidewalks, a city or county must ensure that these infrastructures can be used safely. Recording bike and pedestrian collisions (with cars) can assist in gauging the safety level for walking or bicycling in a community. U.C. Berkeley developed a collision database called the Transportation Injury Mapping System, which provides information regarding crash data for all of California. This is referred to as the Statewide Integrated Traffic Records System (SWITRS). According to the SWITRS a disproportionate amount of collisions within the County’s Urban Services Boundary (USB) involving a bike or pedestrian, occurs in Environmental Justice Communities. Within the USB, 64 percent of fatal collisions that have occurred from 2004 through 2014 are in Environmental Justice Communities. The following Figure 11 shows the number of bicycle and pedestrian collisions per 1,000 residences in each EJ Community and in non-EJ areas.
Figure 11: Bike and Pedestrian Collisions Occurrences (with cars) per 1,000 Residences (2004-2014)
Section titled “Figure 11: Bike and Pedestrian Collisions Occurrences (with cars) per 1,000 Residences (2004-2014)”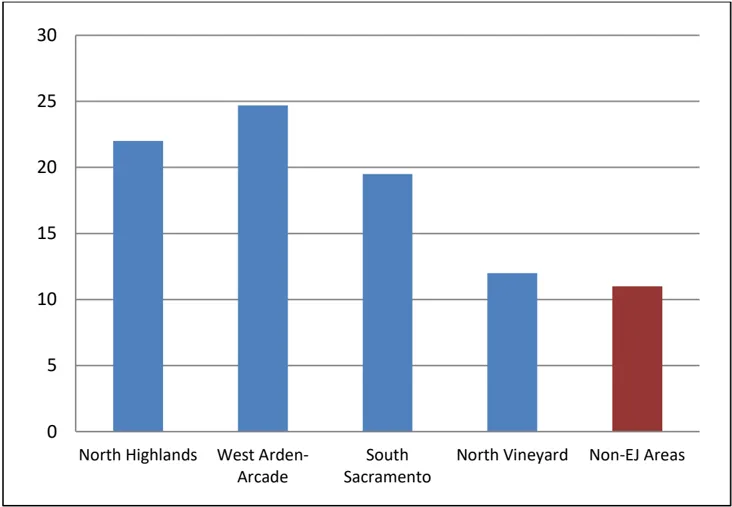
Note: North Highlands includes Foothill Farms and Old Foothill Farms
Source: UC Berkeley Transportation Injury Mapping System, 2017
PROVISION OF PARKS
Section titled “PROVISION OF PARKS”According to the Sacramento County General Plan, parks define the quality of neighborhoods and communities and provide the setting for active and passive recreation that benefits the residents of the immediate neighborhood, the larger community, and the broader region. Two ways to measure sufficient parks provision in a community are park accessibility and acreage.
Park Accessibility : According to Figure 12 below, the South Sacramento and West Arden-Arcade EJ Communities have park accessibility that is greater than or equal to that existing in non-EJ areas. These areas have at least 50 percent of their dwelling units being within a quarter mile of a public park. North Highlands/Foothill Farms is the urbanized area that has the least percentage of dwelling units within a quarter mile of a public park. North Vineyard is a rural area and thus does not have neighborhood parks. Figure 13 and Figure 14 show residential areas in the EJ Communities (except for North Vineyard) that are within a quarter mile of a public park. As shown in these figures, many residential areas are within a quarter-mile of a public park, but there are many other residential areas beyond a quarter-mile.
Figure 12: Percentage of Residences within 1/4 Mile of a Park
Section titled “Figure 12: Percentage of Residences within 1/4 Mile of a Park”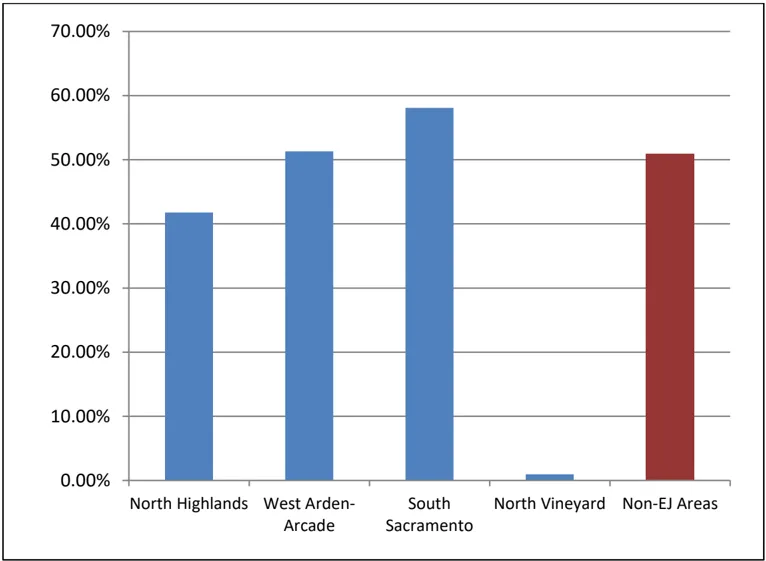
Note: North Highlands includes Foothill Farms/Old Foothill Farms
Source: Sacramento County GIS, 2017
Figure 13: Park Access in North Highlands/Foothill Farms and West Arden-Arcade
Section titled “Figure 13: Park Access in North Highlands/Foothill Farms and West Arden-Arcade”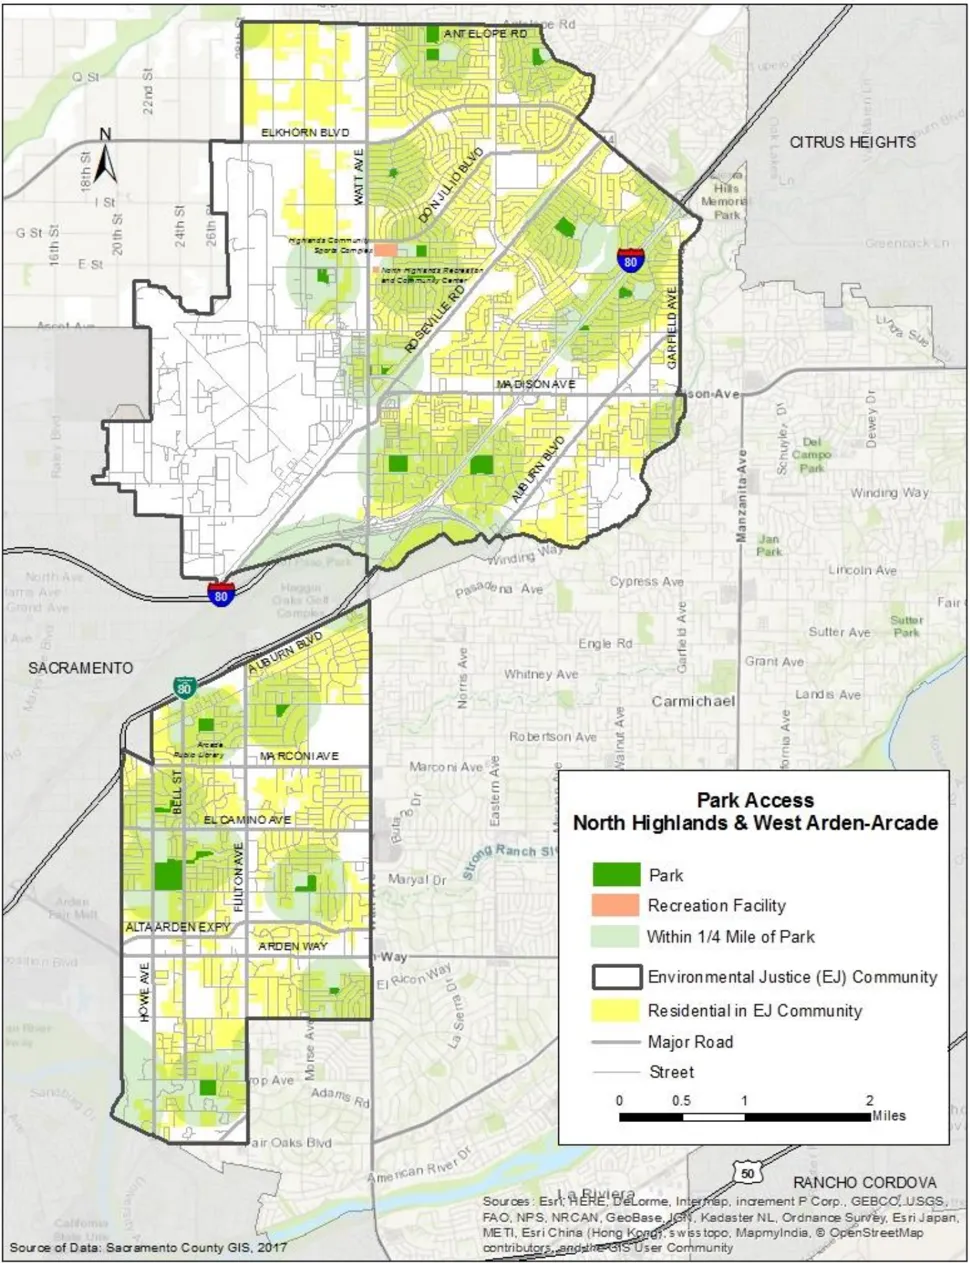
Figure 14: Park Access in South Sacramento
Section titled “Figure 14: Park Access in South Sacramento”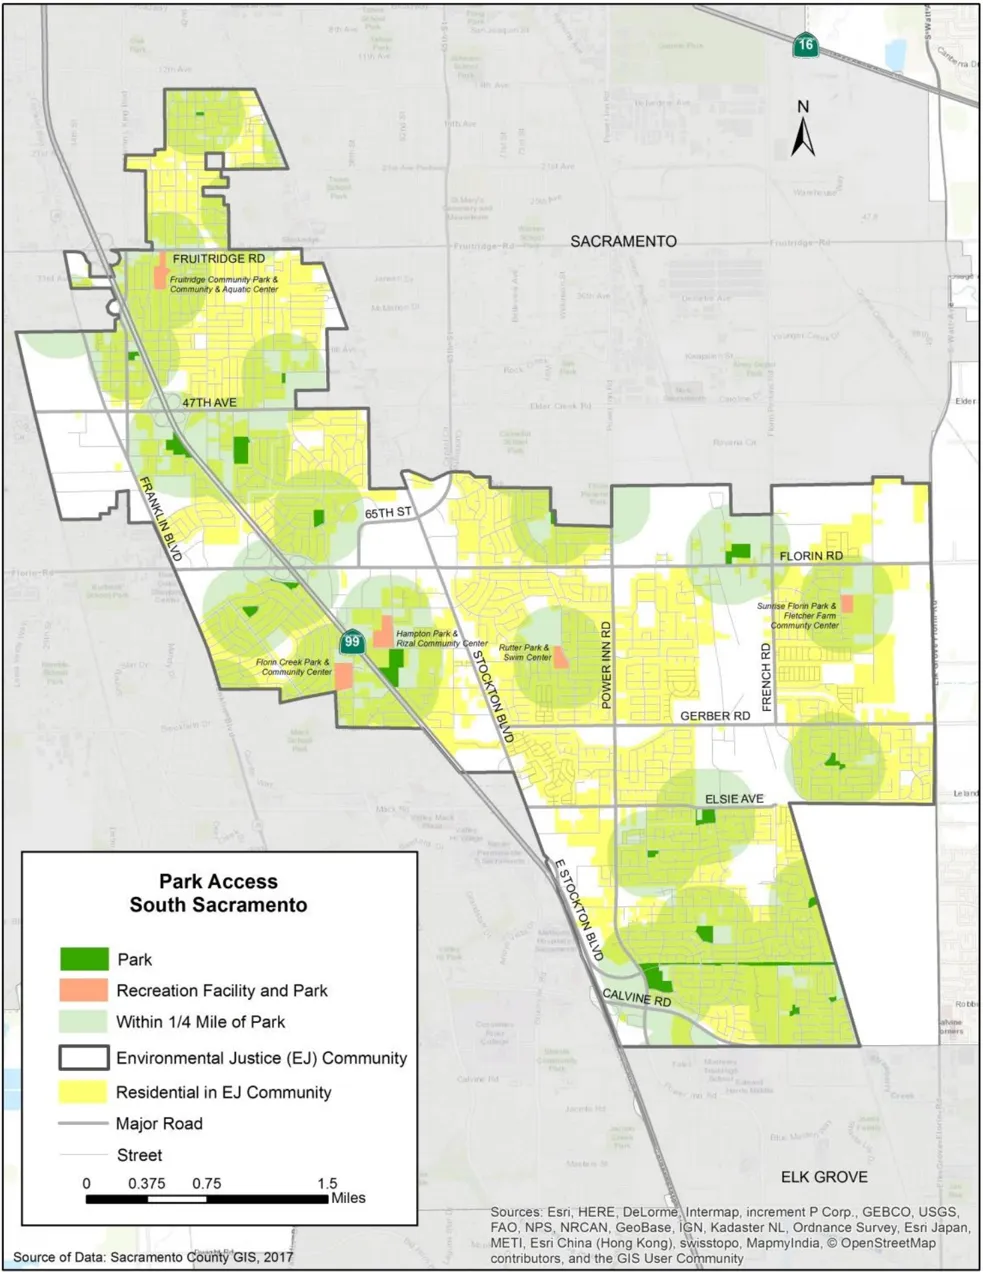
Park Acreage: Though EJ Communities have more residences that are close to public parks than non-EJ areas, non-EJ areas have more park acreage. According to Figure 15, the amount of park acres per 1,000 residences is much higher in non-EJ areas than in the EJ Communities. The non-EJ areas have almost 8.5 acres per 1,000 residences while South Sacramento, the EJ Community with the highest acreage amount has only 5.0 acres per 1,000 residences. The reason for this disproportionality is that communities in the non-EJ areas have large community parks while the EJ Communities lack community parks.
Figure 15: Park Acres per 1,000 Residences
Section titled “Figure 15: Park Acres per 1,000 Residences”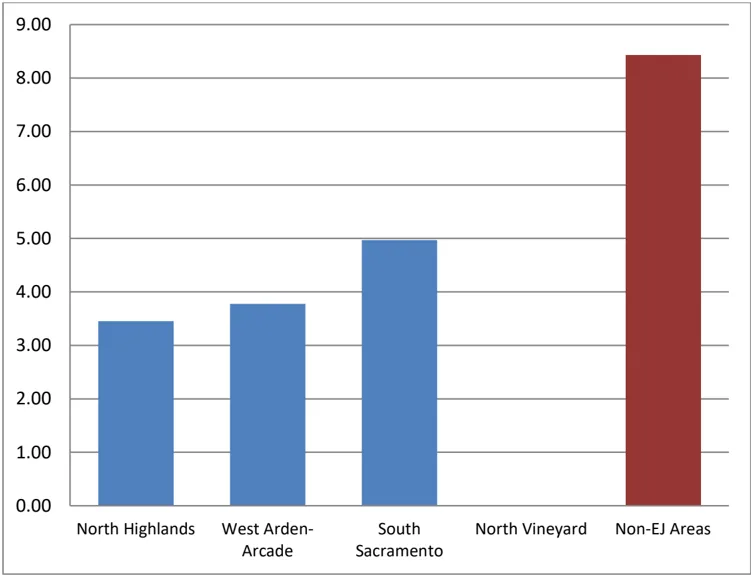
Note: North Highlands includes Foothill Farms/Old Foothill Farms
Source: Sacramento County GIS, 2017
TREE CANOPY
Section titled “TREE CANOPY”The Sacramento Tree Foundation has collected tree canopy data for most of Sacramento County as part of the Green Prescription effort. Research for this effort found that “greater tree canopy was statistically significantly associated (p<0.05) with lower prevalence of overweight/obesity, more leisure vigorous physical activity, better self -reported general health, lower prevalence of asthma, and better neighborhood social cohesion.” This means that a robust tree canopy in a community will encourage more bicycling and pedestrian activity that results in better health and social outcomes.
According to Figure 16, the canopy percentage is lower in North Highlands/Foothill Farms and South Sacramento than that in non-EJ communities. Tree canopy data was extremely limited in North Vineyard and was therefore excluded.
Figure 16: Tree Canopy
Section titled “Figure 16: Tree Canopy”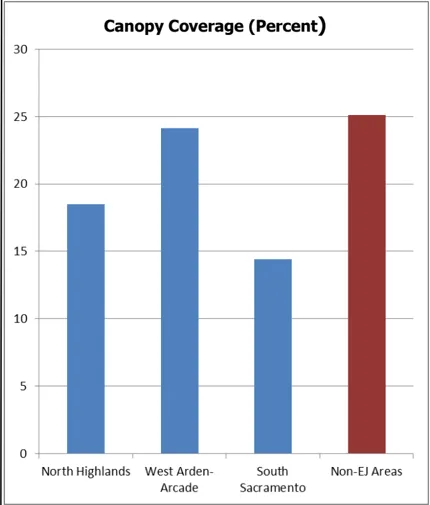
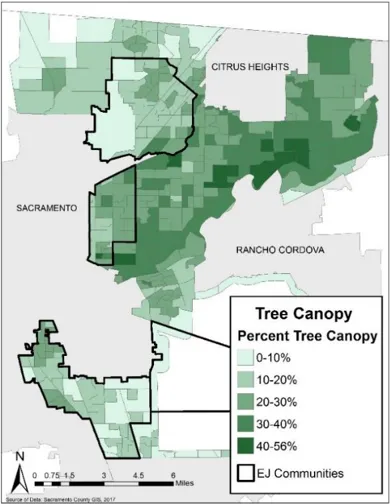
Note: North Highlands includes Foothill Farms and Old Foothill Farms. Source: Sacramento Tree Foundation, 2017
POLICES AND IMPLEMENTATION MEASURES
Section titled “POLICES AND IMPLEMENTATION MEASURES”PROMOTING AND ENCOURAGING PHYSICAL ACTIVITY
Section titled “PROMOTING AND ENCOURAGING PHYSICAL ACTIVITY”Objective
Section titled “Objective”Improve the physical fitness of the unincorporated County’s residents, particularly those who live in Environmental Justice Communities
Intent
Section titled “Intent”Physical activity is essential to increased fitness and overall health of people of all ages. Studies have shown that increased physical activity during in one’s daily life leads to lower mortality rates than those who are sedentary. An active lifestyle that incorporates exercise can prevent or improve chronic illnesses such as coronary heart disease, diabetes, colon cancer and high blood pressure (U.S. Department of Health and Human Services, 2002). Exercise can also prevent or reduce obesity, a condition that contributes to the same chronic illnesses. Finally, physical activity can improve mental health by reducing stress and depression and increasing psychological wellbeing.
Residents throughout the unincorporated County could benefit from increased physical activity, but particularly those who live in Environmental Justice Communities. Obesity rates are higher in the North Highlands/Foothill Farms, South Sacramento and West Arden-Arcade Environmental Justice Communities than in other areas of the unincorporated County (See obesity rates subsection).
Policies (Countywide)
Section titled “Policies (Countywide)”EJ-16.
Section titled “EJ-16.”Promote physical activity programs and education including but not limited to programs offered by the local park and recreation districts and encourage residents to regularly participate in physical activity and active lifestyles.
EJ-17.
Section titled “EJ-17.”Promote walking, biking, and other modes of active transportation as safe, easy, healthy, and fun alternatives for all residents to complete local errands and short trips.
EJ-18.
Section titled “EJ-18.”Encourage school district activities, programs, and master planning efforts that support physical activity and wellness.
Implementation Measures (Countywide)
Section titled “Implementation Measures (Countywide)”- Continue to include guidelines in the County's Countywide Design Guidelines that encourage physical activity (Active Design Guidelines). The Countywide Design Guidelines identify active design guidelines with a logo and has an appendix on active design strategies. (PLANNING AND ENVIRONMENTAL REVIEW)
- Encourage businesses and non-profit organizations to offer indoor recreational facilities and programs compatible with existing commercial structures and zones, such as batting cages, rock climbing walls, basketball/indoor soccer courts, and studios offering martial arts, aerobics, and yoga classes. (PLANNING AND ENVIRONMENTAL REVIEW)
Implementation Measure (Environmental Justice Communities)
Section titled “Implementation Measure (Environmental Justice Communities)”- For non-profit organizations, reduce entitlement fees for use permits for indoor and outdoor general recreational facilities in Environmental Justice Communities and/or reduce level of review for use permits from Planning Commission to Zoning Administrator. (PLANNING AND ENVIRONMENTAL REVIEW)
COMMUNITY DESIGN THAT PROMOTES PHYSICAL ACTIVITY
Section titled “COMMUNITY DESIGN THAT PROMOTES PHYSICAL ACTIVITY”Objective
Section titled “Objective”The construction of urban development projects designed to support physical activity.
Intent
Section titled “Intent”The built environment has a major role in determining a community’s opportunities for physical activity. Like in many other cities and towns in the country, physical development in EJ Communities has been historically geared toward the automobile and not toward pedestrians or bicyclists. Neighborhoods have been designed to provide privacy to residents by minimizing access into the neighborhood and feeding cars into larger and larger roadways (neighborhood street to arterial or thoroughfare). Commercial areas have also been designed for automobiles with large parking lots between the building and the roadway. For pedestrians and bicyclists, these design decisions resulted in less accessibility and unattractive (and sometimes unsafe) travel environments.
Alternatively, certain land use development patterns encourage pedestrian and bicycle travel, which results in having a positive impact on public health. Mixing housing with stores, services, employment, and developing neighborhoods that are more compact can create communities where residents’ daily needs are met with a short walk or bike ride. Greater connectivity between homes, retail, employment, and recreation locations can also encourage more pedestrian and bicycle activity. This is accomplished through grid pattern streets, shorter blocks, and integrated pathways that shorten distances between amenities and other destinations. Within development projects such as apartments and small lot subdivisions, the placement of open space with amenities such as pedestrian walkways, tot-lots, pools, community gardens and small common greens can encourage residents to partake in physical activity.
The ability to apply community design that promotes physical activity varies among the Environmental Justice Communities. West Arden-Arcade is almost at full buildout
with limited infill opportunities, while North Highlands/Foothill Farms and South Sacramento have moderate amounts of vacant land. Major development is expected for North Vineyard due to the establishment of master plans within its borders. In EJ Communities, there are also redevelopment opportunities where developments that are more bicycle and pedestrian friendly can replace existing auto-oriented developments.
Policy (Countywide)
Section titled “Policy (Countywide)”EJ-19.
Section titled “EJ-19.”When planning for new development in new communities, the features below shall be incorporated for their public health benefits and ability to encourage more active lifestyles, unless environmental constraints make this infeasible. In existing communities, the features below shall be considered, as appropriate and feasible:
- Where appropriate, compact, mixed use development and a balance of land uses including schools, parks, jobs, retail and grocery stores, so that everyday needs are within walking distance of homes.
- Grid or modified-grid pattern streets, integrated pathways and public transportation that connect multiple destinations and provide for alternatives to the automobile.
- Wide sidewalks, shorter blocks, well-marked crosswalks, on-street parking, shaded streets and traffic-calming measures to encourage pedestrian activity.
- Walkable commercial areas with features that may include doors and windows fronting on the street, street furniture, pedestrian-scale lighting, and served by transit when feasible.
- Open space, including important habitat, wildlife corridors, and agricultural areas incorporated as community separators and appropriately accessible via non-vehicular pathways.
Implementation Measures (Countywide)
Section titled “Implementation Measures (Countywide)”- At such time the County initiates a rezone program, the Office of Planning and Environmental Review (PER) will rezone properties to multifamily zones that are close to existing services and adjacent to existing bike lanes and sidewalks. (PLANNING AND ENVIRONMENTAL REVIEW)
- Develop a comprehensive Transit-Oriented Development Ordinance that will incentivize transit supportive uses near light rail stations or major transit stops and preserve transit areas for appropriate development opportunities. This ordinance will incorporate the transit-oriented development standards in the TOD Design Guidelines and be applicable to all areas within ½ mile of a light rail station or major transit stop. The Comprehensive Transit-Oriented Development Ordinance will allow flexibility in allowed uses and development standards based on the neighborhood context of the transit station.
orPrepare Master Plans and Special Planning Area ordinances for areas surrounding light rail stations or major transit stops. These planning documents will incentivize transit supportive uses and preserve transit areas for appropriate development opportunities. Many of the transit-oriented development standards in the TOD Design Guidelines will be incorporated into the planning documents. Allowed land uses and development standards will be based on the neighborhood context of the transit station. (PLANNING AND ENVIRONMENTAL REVIEW)
- Coordinate with Department of Health Services, Sacramento County Department of Transportation (SACDOT) and other public health agencies and organizations during master planning efforts to identify and integrate design elements into land use plans that encourage physical activity. (PLANNING AND ENVIRONMENTAL REVIEW, DEPARTMENT OF HEALTH SERVICES, TRANSPORTATION)
- Coordinate with the Department of Health Services to conduct meetings, workshops or public hearings in order to solicit input from interested individuals and organizations on opportunities and recommendations for integrating public health concerns into local land use and transportation planning. (PLANNING AND ENVIRONMENTAL REVIEW, DEPARTMENT OF HEALTH SERVICES, TRANSPORTATION)
ACTIVE TRANSPORTATION
Section titled “ACTIVE TRANSPORTATION”Objective
Section titled “Objective”Improve the pedestrian and bicycle network particularly in Environmental Justice Communities by increasing the quantity of pedestrian and bicycle facilities and by increasing the quality of new and existing facilities in terms of user safety.
Intent
Section titled “Intent”Wide participation in ‘Active Transportation’ which includes non-motorized forms of transportation (bicycling, walking and scootering) has both health and environmental benefits. Active transportation encourages physical activity and reduces rates of overweight and chronic diseases. Active transportation can also replace vehicle trips, which is a significant contributor of air pollution in Sacramento County. This air pollution is a major factor in causing asthma, lung cancer, respiratory and cardiovascular disease (see Pollution Exposure Section).
The extent of the active transportation network is important; the more people are reached by this network, the more this network will be used. However, to be truly useful, this active transportation network must not only reach the users of this network but must also connect them to desirable destinations; it must enable people to go to places where they want to go. Finally, the active transportation network must be safe to use. If potential users perceive that using the network is not safe, they will not use the network.
In the past, auto transportation has been prioritized over active transportation. In many communities, the auto transportation network is well developed while the active transportation network is non-existent or semi-developed with minimal features for the safety and enjoyment of pedestrians and bicyclists. However, more recently, features that make walking and biking much safer have been incorporated into the design of the streetscape. These include installing traffic-slowing features, adding bike lanes, establishing well-defined crosswalks, building wider sidewalks and buffering pedestrians from traffic. In addition to making the streetscape safer for pedestrians and bicyclists, other features have been incorporated into the design of the streetscape to make walking and bicycling more enjoyable. These include providing interesting and attractive streetscapes, stores fronting on the street with minimal setbacks, street furniture, shade trees and inviting public spaces. Many of the features have been incorporated into smart growth street projects, which strive to design streets and the surrounding street corridor for all modes of travel.
The General Plan, the Countywide Design Guidelines and the Zoning Code require many of the features that increase the safety and enjoyment of pedestrians and bicyclists. One concept that has not yet been incorporated into these documents is the concept of ‘level of stress’ (LTS) which evaluates bikeways by matching roadway design, traffic volumes and speeds with bicyclist level of stress. This concept is gaining
currency in transportation planning field. With LTS, a less stressful bicycle network can be created which encourages more people to use the network.
Policies (Countywide)
Section titled “Policies (Countywide)”EJ-20.
Section titled “EJ-20.”The County will continue to support walking and bicycling by requiring smart growth streets (bike lanes, and sidewalks separated from the roadway with trees and planted landscaping) in transit priority areas, in Environmental Justice Communities and in new communities and developments wherever practicable.
EJ-21.
Section titled “EJ-21.”Provide safe, low stress, interesting and convenient environments for pedestrians and bicyclists, including inviting and adequately lit streetscapes, networks of trails, paths, parks, and open spaces that connects residences with key destinations, and encourages regular exercise and the reduction of vehicular emissions.
Implementation Measures (Countywide)
Section titled “Implementation Measures (Countywide)”- Department of Transportation will combine the Bicycle and Pedestrian Master Plans into one comprehensive document. The new document will incorporate the concept of reducing 'level of stress' (LTS) for bicyclists and pedestrians. (TRANSPORTATION)
- Evaluate bicycle circulation plans for new master plans and large infill projects using the principles of low stress bicycling. (TRANSPORTATION, PLANNING AND ENVIRONMENTAL REVIEW)
- Apply low stress bicycling principles to Complete Streets Master Plans. (TRANSPORTATION, PLANNING AND ENVIRONMENTAL REVIEW)
Implementation Measures (EJ Communities)
Section titled “Implementation Measures (EJ Communities)”- Environmental Justice Communities will be prioritized for Smart Growth Streets programs. (TRANSPORTATION)
- Environmental Justice Communities will be prioritized for new sidewalks, particularly along major streets and near parks and schools. (TRANSPORTATION)
PROVISION OF ACCESSIBLE RECREATIONAL FACILITIES
Section titled “PROVISION OF ACCESSIBLE RECREATIONAL FACILITIES”Objective
Section titled “Objective”All neighborhoods have access to a public park or similar facility, particularly neighborhoods that are in Environmental Justice Communities.
Intent
Section titled “Intent”The County of Sacramento has many parks, open space, and recreation facilities available to the residents and visitors. Having access to these facilities is important to promote physical activity. The Sacramento County General Plan states:
People rely on Sacramento’s parks and recreational facilities for the pursuit of health and fitness, self-education, connection with nature and positive social activities. From toddlers through teens, adults, and senior citizens, people of all ages enjoy the trails, natural and cultural resources, sports fields and courts, nature centers, playgrounds, swimming pools and community centers that the region provides. Parks define the quality of neighborhoods and communities and provide the setting for active and passive recreation, which benefits the residents of the immediate neighborhood, the larger community, and the broader region. (Sacramento County, 2011)
Baseline condition research (See Baseline Conditions Sub-Section) concluded that at the community scale, access to public parks (park within a quarter mile of residences)
in EJ Communities (except for North Vineyard) is higher than in non-EJ areas. There are large residential areas within EJ Communities that are not within quarter mile of a park. The County or a nongovernmental organization (NGO) can identify these areas and can advocate for the location of new parks in those neighborhoods if there is suitable vacant land available and if there is community support for a new park.
Besides distance from a park, evaluating park accessibility also includes identifying physical barriers that keep residents from easily accessing the parks. For new developments, a public health official can evaluate park accessibility during the development review process.
Policy (Countywide)
Section titled “Policy (Countywide)”EJ-22.
Section titled “EJ-22.”Parks should easily be accessible to the surrounding neighborhood and beyond and be as barrier-free as possible, particularly for those with limited mobility.
Implementation Measure (Countywide)
Section titled “Implementation Measure (Countywide)”- Park accessibility will be analyzed, during the review of master plans and tentative subdivision maps. (DEPARTMENT OF HEALTH SERVICES, PLANNING AND ENVIRONMENTAL REVIEW)
Implementation Measure (EJ Communities)
Section titled “Implementation Measure (EJ Communities)”- The County will support efforts through analysis and public comments to identify neighborhoods in Environmental Justice Communities that lack access to public parks and identify vacant land that could be used for public parks. The County will also support efforts to contact recreation and park districts to advocate for public parks or alternative permanent or temporary facilities (such as pocket parks or pop-up parks) in neighborhoods that lack access to public parks. (PLANNING AND ENVIRONMENTAL REVIEW)
TREE CANOPY
Section titled “TREE CANOPY”Objective
Section titled “Objective”Increase tree canopy in Environmental Justice Communities, to levels existing in urbanized areas that are outside of EJ Communities.
Intent
Section titled “Intent”A robust tree canopy can encourage physical activity by providing shade to pedestrians and bicyclists and beautifying their environment. Healthy tree canopy exists in many of Sacramento County’s most desirable neighborhoods that adds to the economic value of homes in the neighborhoods. A healthy tree canopy also benefits business districts where studies have shown that people actually spend more when the district has a robust tree canopy. Besides aesthetics and financial benefits, a robust tree canopy can have environmental benefits by shielding hardscape and roofs from heat waves, thus reducing the heat island effect and reducing exposure to air contaminants.
There is a need for a more extensive tree canopy in some of the EJ Communities. Percentage of area covered by tree canopy in West Arden-Arcade is similar to that in non-EJ areas but the percentages in North Highlands/Foothill Farms and South Sacramento EJ Communities are much less.
There is an existing program to expand the tree canopy in the Sacramento region. The Sacramento Tree Foundation introduced Greenprint, previously called the Sacramento Regional Urban Forest Framework, as an initiative to double the tree canopy in 40 years. Greenprint seeks to increase the Sacramento region’s average shade coverage to 35 percent and established tree canopy goals and strategies for each municipality in the region.
Besides expanding the tree canopy in the unincorporated County particularly in EJ Communities, it is important to preserve the existing tree canopy. The County’s Tree Preservation ordinance and Conservation Element recognize the value of preserving trees and seek to protect the resource by protecting trees from removal without compensation. However, this does not address any existing canopy deficiencies.
Policy (EJ Community)
Section titled “Policy (EJ Community)”EJ-23.
Section titled “EJ-23.”The County will achieve equitable tree canopy in EJ Communities.
Implementation Measures (EJ Communities)
Section titled “Implementation Measures (EJ Communities)”During California Environmental Quality Act review of impacts for public works, private development, revitalization and master planning projects in under-canopied EJ Communities, mitigation shall be required that provides an extra 25% tree replacement and said mitigation shall be directed to the same EJ community where the impact occurs. (PLANNING AND ENVIRONMENTAL REVIEW)
Policies (Countywide)
Section titled “Policies (Countywide)”EJ-24.
Section titled “EJ-24.”Increase tree canopy coverage to at least 35 percent in all unincorporated County neighborhoods by 2040, especially those that are in Environmental Justice Communities.
EJ-25.
Section titled “EJ-25.”Consistently enforce existing Tree Protection Ordinances including the zoning code, the Tree Ordinance (SCC 19.04) and the Tree Preservation Ordinance (SCC 19.12).
Implementation Measures (Countywide)
Section titled “Implementation Measures (Countywide)”- As a condition of approval for discretionary projects, Sacramento County shall require the appropriate remedy for any open tree violations on site. (PLANNING AND ENVIRONMENTAL REVIEW)
- Sacramento County will continue to support Sacramento Tree Foundation's NeighborWoods program in order to help achieve 35 percent tree canopy coverage in Sacramento County neighborhoods. (PLANNING AND ENVIRONMENTAL REVIEW)
- Survey EJ communities to identify appropriate opportunity sites to receive tree mitigation plantings. (PLANNING AND ENVIRONMENTAL REVIEW)
SECTION 8: PROMOTE PUBLIC FACILITIES
Section titled “SECTION 8: PROMOTE PUBLIC FACILITIES”An adequate supply of public facilities is a critical component to the current and future prosperity of a community. Under state law (SB 1000), ‘public facilities’ acts as an umbrella term that includes ‘public improvements, public services, and community amenities’. This covers a wide spectrum of publicly provided uses and services including infrastructure, school facilities, parks, and transportation and emergency services. These amenities and services act to improve the health, safety, and wellness of a community by either enhancing the public sphere or providing services that are available to every resident.
Insufficient public facilities can have significant impacts to the health and quality of life of the community. For example, communities that lack basic infrastructure such as sidewalks and streetlights present safety hazards for people using public spaces, particularly individuals that depend on alternate modes of transportation (i.e., walking, riding a bike, waiting for a bus, etc.). In addition, communities that lack facilities such as open space, community centers and parks may not have the same quality of life as others that reside in communities with those facilities.
In many cases, the mere existence of certain public facilities is not enough to ensure it is sufficient. Public facilities must keep pace with community needs and maintenance requirements in order to continue providing an acceptable level of service to the community.
Historically, Environmental Justice Communities have struggled with insufficient access to public facilities and substandard amenities more than other communities. In order to assess the availability of public facilities in the County’s EJ communities, this section contains an assessment of existing facilities.
Community Centers such as the Conzelmann Community Center in West Arden-Arcade are community gathering places.
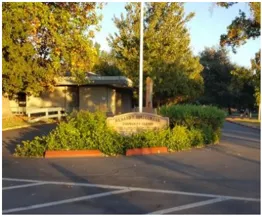
BASELINE CONDITIONS
Section titled “BASELINE CONDITIONS”EXISTING FACILITIES AND COMMUNITY AMENITIES
Section titled “EXISTING FACILITIES AND COMMUNITY AMENITIES”Many public services are provided by special districts that are not directly accountable to the County of Sacramento. Therefore, it is important to focus this section on the aspects of public facilities that the County does control. For example, the County can guide the siting of new public facilities in new growth areas. The operation and maintenance of existing facilities, however, is usually under the purview of the relevant special district or County agency responsible for those types of facilities.
Staff assessed existing public facilities in EJ Communities. This assessment focused on facilities that act as community amenities or sites of emergency service providers. Staff mapped these facilities as well as residential areas in each EJ Community (Figure 17, Figure 18 and Figure 19). The Physical Activity Section covers parks and pedestrian/bicycle facilities.
PUBLIC SCHOOLS
Section titled “PUBLIC SCHOOLS”In Sacramento County, there are 14 school districts serving approximately 244,400 students. Each school district is independently governed and operated. These school districts are responsible for the operation of 413 public schools ranging from prekindergarten to post-secondary education. Seven school districts serve the County’s EJ Communities. There are two high schools in the North Highland/Foothill Farms EJ Community and one high school each in the West Arden-Arcade and South Sacramento EJ Communities. Due to its relatively higher population, South Sacramento should have more than one high school but many students within this EJ Community attend high schools that are within the City of Sacramento. Elementary schools are generally well distributed throughout the EJ Communities (except for North Vineyard) but some neighborhoods (particularly in South Sacramento) are lacking an elementary school.
PUBLIC LIBRARIES
Section titled “PUBLIC LIBRARIES”Libraries are also a critical public service and are a signature of a healthy community that define quality of life for businesses, families and individuals that live in the community. In Sacramento County, the Sacramento Public Library Authority (a joint powers authority) manages 28 library facilities. Public libraries provide free access to reading material, homework zones (tutoring services offered), adult learning (adult literacy assistance and GED services), makerspace (creating music, virtual and realworld designs, etc.) and other items for check out from crafting machines to yard equipment.
The Arcade Library serves the northern portion of the West Arden-Arcade EJ Community while the Arden-Dimick Library, which is located approximately one-half mile from the EJ Community, serves the southern portion. There is no public library in the North Highlands/Foothill Farms EJ Community but the North Highlands/Antelope Library is adjacent to the community’s northern boundary. However, due to its location, residents who live in the southern half of the EJ Community may have difficulty accessing this library. Three libraries serve the South Sacramento EJ Community. The Colonial Heights Library serves the northern portion of the EJ Community, the Southgate Library serves the central portion and the Valley Hi - North Laguna Library (not shown in Figure 19) serves the southern portion.
Libraries such as the Southgate library in South Sacramento are important resources for the community.
Photo Source: Sacramento Public Library, Southgate Library Facebook Page, https://www.facebook.com/saclibrarysouthgate/
EMERGENCY FACILITIES
Section titled “EMERGENCY FACILITIES”The Community Amenities Maps show emergency facilities such as sheriff’s and fire stations. Sheriff’s stations act as local hubs for the County Sheriff’s Department in the community. While the Sheriff’s Department provides specialized law enforcement services to the whole County, it acts as a local police force in the unincorporated areas. Fire stations are under the control of whatever fire district is responsible for that area. Fire districts provide emergency medical rescue and fire protection services in their jurisdiction. Like park districts, fire districts can either function as independent or dependent districts. All fire districts in the County, other than the Natomas Fire District, operate as independent districts.
Each of the EJ Communities (with the exception of North Vineyard) has at least one Sheriff’s station within or near its boundaries. North Highlands/Foothill Farms has a station serving the North Highlands portion of the community while another station that is adjacent to the community’s eastern boundary serves the Foothill Farms portion. West Arden-Arcade and South Sacramento EJ Communities each have one centrally located Sheriff’s station. The northern portion of the South Sacramento EJ Community is near a City Police Station (not shown on Figure 19).
The Sacramento Metropolitan Fire District (Sacramento Metro Fire) serves all of the North Highlands/Foothill Farms, North Vineyard and West Arden-Arcade EJ Communities and the southern half of the South Sacramento EJ Community. The Sacramento City Fire Department (City Fire) serves the northern half of the South Sacramento EJ Community. The service areas for both Sacramento Metro Fire and City Fire are divided into districts based on response times from a fire station.
COMMUNITY CENTERS
Section titled “COMMUNITY CENTERS”Community centers provide multiple benefits to a community by being centers of activity for community members of all ages. These facilities can provide space for recreational and educational activities and provide meeting rooms for community groups. Community centers can also be venues for community events and be rented out for banquets and weddings. The local recreation and park district owns and
maintains these facilities and administer many of the activities that occur at the centers. Community centers are often located in public parks.
Community centers within the EJ Communities are generally well distributed throughout the community with each EJ Community having at least one community center (Figure 18 and Figure 19). The North Vineyard EJ Community currently does not have a community center due to it being rural (Figure 17). The following lists the community centers that serve residents in EJ Communities:
- North Highlands/Foothill Farms: There are two community centers serving the North Highland/Foothill Farms EJ Community. The North Highlands Recreation and Community Center, operated by the North Highlands Recreation and Park District, is located in the North Highlands portion of the EJ Community. There is also the Foothill Community Center, operated by the Sunrise Recreation and Park District. This facility is located a quarter-mile from the EJ Community boundary and serves the Foothill Farms portion of the EJ Community.
- South Sacramento: The South Sacramento EJ Community has four community centers. The northern portion of the EJ Community has the Fruitridge Community and Aquatic Center. The eastern portion of the EJ Community has the Fletcher Farm Community Center. There are also two community centers relatively close to each other (Florin Creek Community Center and Rizal Community Center) that are located in central portion of the EJ Community. All of these facilities are operated by the Southgate Recreation and Park District. Currently there is no community center in the southern portion of the EJ Community.
- West Arden-Arcade: The West Arden-Arcade EJ Community has two community centers. The Conzelmann Community Center, operated by the Fulton-El Camino Recreation and Park District, is located in the central portion of the EJ Community. There is also the Swanston Community Center, operated by the Mission Oaks Recreation and Park District, which is located in the southern portion of the EJ Community. As of 2019, the Fulton-El Camino Recreational and Park District is planning to construct a new community center in the northern portion of the EJ Community.
Figure 17: Community Facilities in North Vineyard
Section titled “Figure 17: Community Facilities in North Vineyard”
Figure 18: Community Facilities in North Highlands/Foothill Farms and West Arden-Arcade
Section titled “Figure 18: Community Facilities in North Highlands/Foothill Farms and West Arden-Arcade”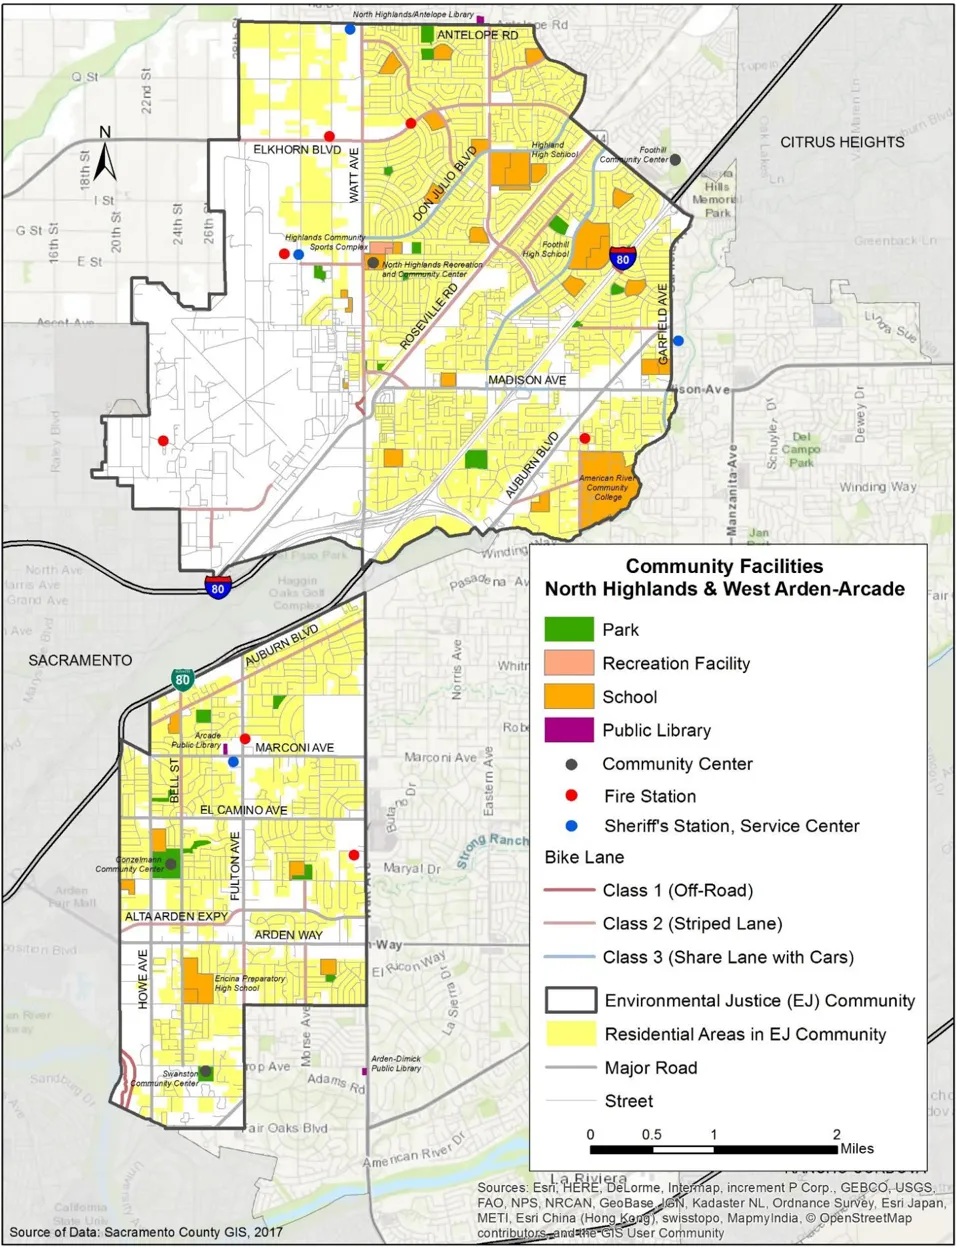
Figure 19: Community Facilities in South Sacramento
Section titled “Figure 19: Community Facilities in South Sacramento”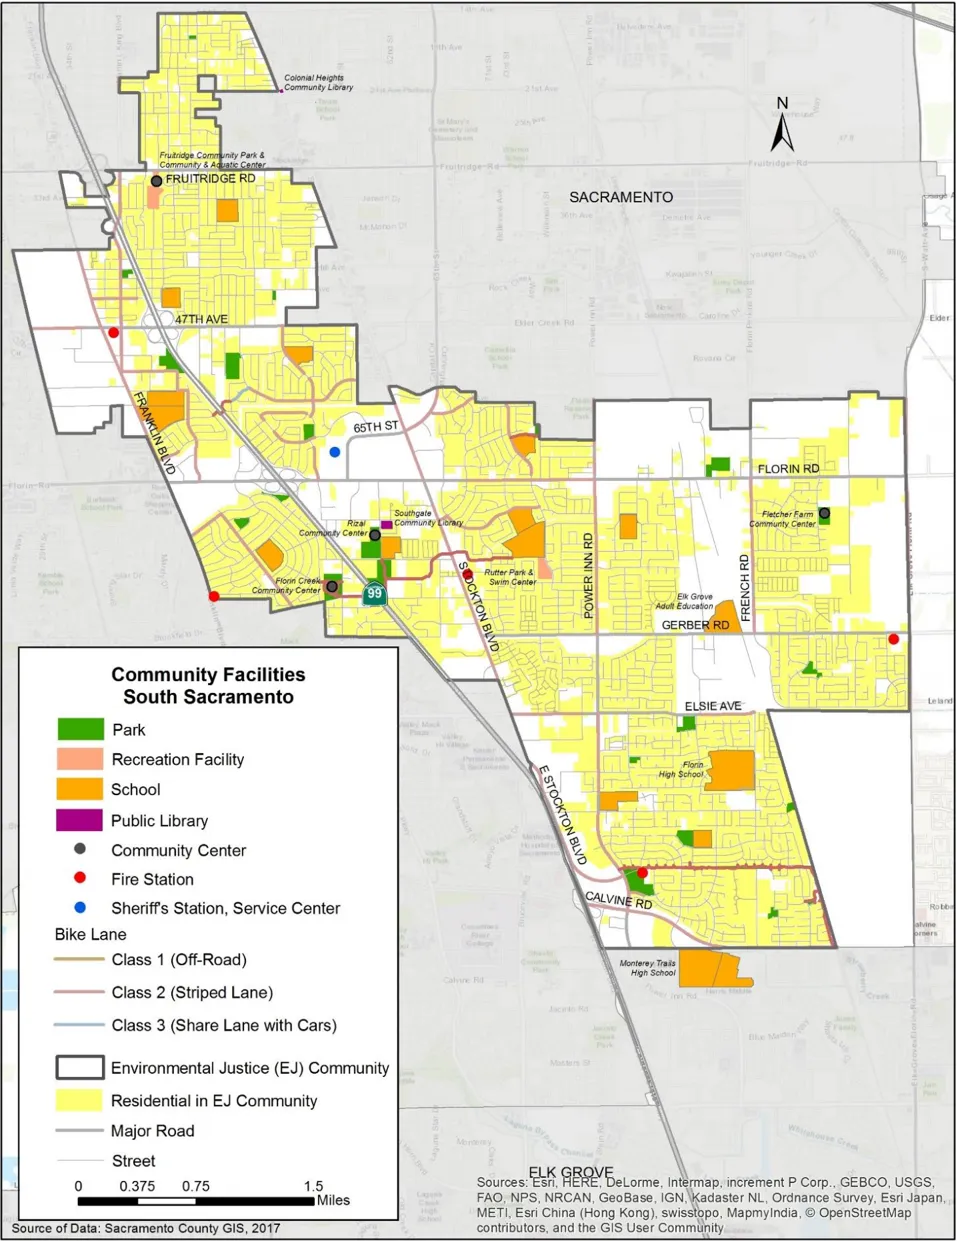
POLICIES AND IMPLEMENTATION MEASURES
Section titled “POLICIES AND IMPLEMENTATION MEASURES”EQUITABLE DISTRIBUTION OF PUBLIC FACILITIES AND SERVICES
Section titled “EQUITABLE DISTRIBUTION OF PUBLIC FACILITIES AND SERVICES”Objective
Section titled “Objective”Public facilities and services will be equitably distributed throughout Environmental Justice Communities to the level that exists in the remainder of the urbanized unincorporated County.
Intent
Section titled “Intent”Public Facilities are essential for creating and maintaining healthy, connected and vibrant communities within Sacramento County. It is important to reevaluate the public facilities within the EJ Communities, as most of these communities were developed with an auto-centric lens. New development encourages walkability and connectivity amongst neighbors and community gathering spots, which usually include more parks, community centers and other public facilities. To ensure similar opportunities in EJ Communities, the County will advocate for equitable distribution for public facilities and services.
Policy (Countywide)
Section titled “Policy (Countywide)”EJ-26.
Section titled “EJ-26.”Sacramento County will advocate for equitable distribution of public facilities and levels of service within EJ Communities amongst service districts.
EJ-27.
Section titled “EJ-27.”When siting new civic buildings and County offices, preference shall be given to locations in Environmental Justice Communities.
Implementation (Countywide)
Section titled “Implementation (Countywide)”- Sacramento County will encourage future advances in technology and transportation to be equitably distributed to include low-income, elderly, disabled, and technology-limited riders, particularly in Environmental Justice Communities.
Related Policies in Other Elements
Section titled “Related Policies in Other Elements”- Policy LU-68 in the Performance Standards Section of the Land Use Element.
- Policy HE 3.3.1 in the Housing Element.
SECTION 9: REDUCE POLLUTION EXPOSURE
Section titled “SECTION 9: REDUCE POLLUTION EXPOSURE”Pollution exposure occurs when people are exposed to air, food, water, and soil contaminants due to conflicting land uses sited adjacent to each other. Sensitive populations (such as children, the elderly, and those with compromised immune systems) and sensitive land uses are the most susceptible to pollution exposure. EJ Communities are often disproportionately burdened by multiple sources of pollution exposure (California Environmental Justice Alliance, 70). Pollution can come from many sources including solid waste facilities emitting toxic gases, storage tanks leaking hazardous chemicals into groundwater and soil, agricultural land uses applying pesticides, mobile sources such as vehicles emitting exhaust, and stationary sources such as diesel engines emitting exhaust.
State Government Code Section 65302(h) requires that the EJ Element cover the unique or compounded health risks in disadvantaged communities due to pollution exposure. Therefore, this Element focuses on local instances of pollution in EJ Communities. It should be noted that a more robust discussion of pollution and contamination on the regional level could be found in the Air Quality and the Hazardous Materials Elements of the General Plan.
BASELINE CONDITIONS
Section titled “BASELINE CONDITIONS”ASTHMA
Section titled “ASTHMA”Exposure to high levels of traffic and air pollutants such as particulate matter, ozone, and diesel exhaust can result in higher rates of asthma onset and asthma aggravation. It has been documented that air pollution is an asthma trigger for some asthmatics. People who live, work or go to school near major roads have an increased incidence and severity of health problems in addition to asthma such as cardiovascular disease, impaired lung development in children, childhood leukemia, and premature death. Sensitive receptors such as children, older adults, and those with preexisting medical conditions are especially impacted.
As shown by Figure 20, the average number of asthma related emergency department visits per 10,000 people is much higher in the North Highlands/Foothill Farms, South Sacramento and West Arden-Arcade EJ Communities than they are in the North Vineyard EJ Community and non-EJ areas. In fact, the rate of asthma emergency visits for North Highlands/Foothill Farms, South Sacramento and West Arden-Arcade are among the worst in the state. The rates for the North Highlands/Foothill Farms and South Sacramento EJ Communities are among the highest 10 percent in the state. The rate for West Arden-Arcade is among the highest 20 percent.
The higher prevalence of asthma-related emergency room visits in the three EJ Communities could be due, in part, to their proximity to high volume roadways. The North Highlands/Foothill Farms and West Arden-Arcade EJ Communities contain Interstate 80 while the South Sacramento EJ Community contains State Highway 99. West Arden-Arcade is also bounded on the east by Watt Avenue which has a very high volume of traffic compared to other thoroughfares in the County. With the presence of high volume roadways within their boundaries, many census tracts in the North Highlands/Foothill Farms, South Sacramento and West Arden-Arcade EJ Communities score in the top third tier in the state for traffic density (vehicle km/hr divided by total road length).
Figure 20: Asthma Emergency Visits (2011-2013)
Section titled “Figure 20: Asthma Emergency Visits (2011-2013)”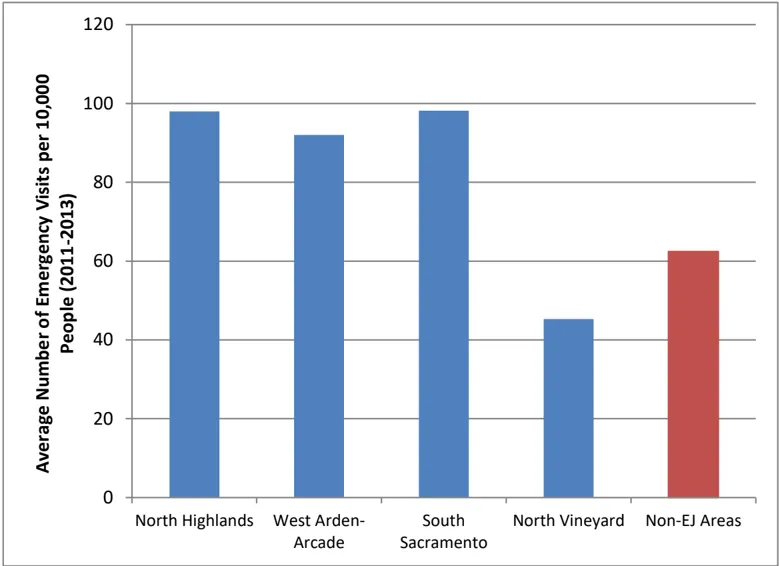
Note: North Highlands includes Foothill Farms and Old Foothill Farms. Source: CalEnviroscreen, 2017.
Ozone is a form of oxygen that is extremely reactive. Humans are protected from the sun’s ultraviolet rays by ozone in the upper atmosphere. However, because of its highly reactive nature, ozone is the primary cause of smog in the lower atmosphere by reacting with other air pollutants in the presence of sunlight. Ozone levels usually vary during the day with the highest levels in the afternoon and on hot days.
With ozone pollution, breathing becomes restricted when the muscles in the lung airways become constricted and air in the alveoli is trapped. The physical response of this condition is wheezing and shortness of breath. Long-term exposure to ozone pollution could result in worsening of asthma symptoms and causes in developing asthma. Long-term exposure to high concentrations of ozone pollution can result in permanent lung damage, such as abnormal lung development in children and decreased lung function (EPA, 2018).
According to the American Lung Association’s State of the Air 2018 report, Sacramento County during 2014 to 2016 was the 14 th most ozone-polluted county in the nation with 31.8 unhealthy zone days. The level of ozone pollution in the County is not greater in EJ Communities than in non-EJ areas but generally increases with elevation when pollution from urbanized areas in lower elevations travel to the foothills and become trapped.
DIESEL PARTICULATE MATTER
Section titled “DIESEL PARTICULATE MATTER”Diesel particulate matter (diesel PM) is emitted by diesel engines and is comprised of very small particles, or ‘soot’ coated with numerous organic compounds (California Air Resources Board). Both on-road and off-road sources such as trucks, buses, cars, ships, and locomotive engines emit diesel particulate matter. The concentration of these sources near ports, rail yards and freeways, results in these areas having high levels of diesel PM. Exposure to diesel PM have been shown to have numerous adverse health effects which include irritation to the eyes, throat and nose, cardiovascular and pulmonary disease, and lung cancer. Diesel engine emissions are responsible for about 70 percent of California’s estimated known cancer risk associated with toxic air contaminants (California Air Resources Board).
Pollutants associated with a high volume of traffic include particulate matter, nitrogen oxides, benzene, and carbon monoxide.
Copyright 2016 City of Gastonia (CC BY-NC 4.0), from the American Planning Association’s Image Library.
According to Figure 21, EJ Communities with the exception of North Vineyard have higher levels of diesel PM than non-EJ areas. Freeways with their high traffic volumes are a major source of diesel particulates in EJ Communities. Interstate 80 extends through the North Highlands/Foothill Farms EJ Community and is adjacent to the West Arden-Arcade EJ Community. State Highway 99 extends through the South Sacramento EJ Community. Extensive segments of these freeways are adjacent to residential areas.
According to Figure 21, South Sacramento EJ Community has the highest level of diesel PM. Besides Highway 99, another likely contributor of diesel PM in South Sacramento is truck traffic caused by industrial businesses within the community. Many of these businesses are adjacent to residential neighborhoods and have operating trucks. This situation results in reducing the air quality of adjacent residential neighborhoods. Trucks traveling to and from industrial areas can also reduce the air quality of neighborhoods that are adjacent to the truck routes.
Figure 21: Diesel Particulate Matter (July 2012)
Section titled “Figure 21: Diesel Particulate Matter (July 2012)”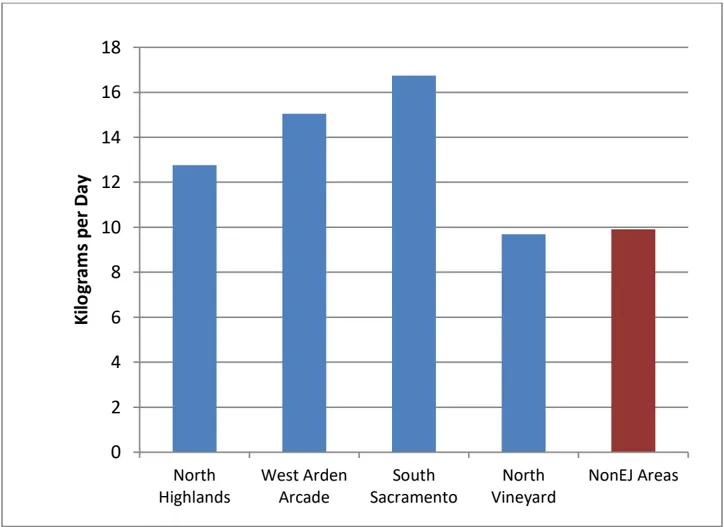
Note: North Highlands includes Foothill Farms and Od Foothill Farms
Source: CalEnviroscreen, 2017
PESTICIDES
Section titled “PESTICIDES”A large portion of Sacramento County consists of agricultural areas. Pesticides applied in agricultural areas can drift into neighboring communities and cause illness and, in some cases, longer-term health conditions such as birth defects or cancer. The Agricultural Resources Element of the General Plan contains several policies that require buffers between agricultural land uses and incompatible land uses in order to prevent undue exposure and intend to protect farmland from urban encroachment. However, encroachment of urban development into agricultural communities often results in the placement of conflicting land uses adjacent to each other.
CalEnviroScreen uses records from the California Department of Pesticide Regulation to determine pesticide scores for census tracts. A pesticide score for a census tract is determined by dividing the number of pounds per square mile of select active ingredients in pesticides during 2012-2014 by the area of the census tract. In comparison to the other EJ Communities and non-EJ areas (Figure 22), the South Sacramento EJ Community had the highest pesticide score. This was unexpected because South Sacramento has a limited amount of agriculturally zoned land. The North Vineyard EJ Community had the second highest score, which is the result of having a relatively large amount of agricultural land. There are no agricultural lands in North Highlands/Foothill Farms and West Arden-Arcade. North Vineyard is currently a rural community where future urban growth is planned.
Figure 22: Pesticides (2012-2014)
Section titled “Figure 22: Pesticides (2012-2014)”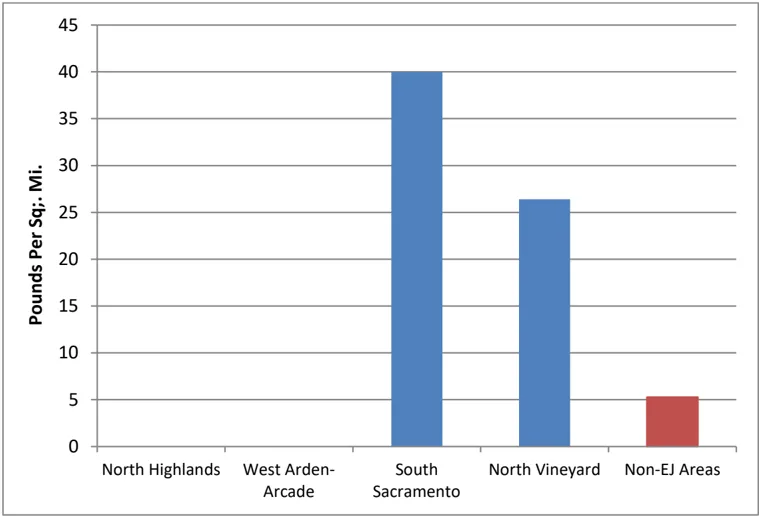
Note: North Highlands includes Foothill Farms and Od Foothill Farms
Source: CalEnviroscreen, 2017
WATER CONTAMINATION
Section titled “WATER CONTAMINATION”Groundwater Threats
Section titled “Groundwater Threats”Public water systems that rely on groundwater serve many areas in Sacramento County. However, sources such as industrial operations, leaking underground storage tanks, irrigated agricultural land and confined animal feeding operations can potentially contaminate groundwater basins.
In determining groundwater threats, CalEnviroscreen uses data from GeoTracker, a State Water Resources Control Board database that identifies sites that impact or potentially impact water quality. CalEnviroscreen assigns a score to each cleanup site, applies a weight to the site based on the type and then adjusts the score based on the site’s distance from urban areas. Each census tract was scored based on the sum of the adjusted scores of cleanup sites that are within the census tract.
The North Highlands/Foothill Farms EJ Community had the highest score for groundwater threats (Figure 25) among EJ Communities and non-EJ areas. The large number of military cleanup sites at the former McClellan Air Force Base (an Environmental Protection Agency Superfund site) contributes to the high score. There
are 326 areas of known and suspected contamination at McClellan but many of the identified sites have completed remediation or are in the process of remediation. The North Vineyard EJ Community score is misleading because this score is based on a geographic area (census tract) that does not match the EJ Community’s boundaries. Many of the groundwater threat sites in the census tract are in the City of Sacramento (within or near the former Sacramento Army Depot). There are also cleanup sites in the South Sacramento EJ Community and the northern portion of the West ArdenArcade EJ Community. Some of these contributed to relatively high groundwater threat scores for particular census tracts within these EJ communities.
Figure 23: Groundwater Threat Sites (2016)
Section titled “Figure 23: Groundwater Threat Sites (2016)”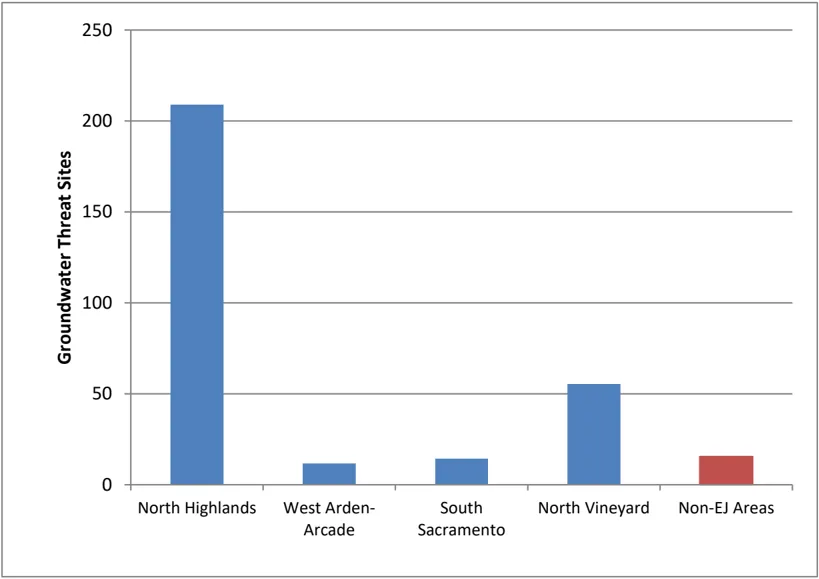
Note: North Highlands includes Foothill Farms and Old Foothill Farms
Source: CalEnviroscreen, 2017
Drinking Water Contamination
Section titled “Drinking Water Contamination”There are over 20 private and public water purveyors in Sacramento County and therefore residents in unincorporated Sacramento County receive their drinking water from a wide variety of sources and distribution systems. The quality of drinking water can vary based on where a person lives in the County. Location, water source, treatment method and the water district’s ability to remove contaminants all impact drinking water quality.
Drinking water contamination is a threat to public health because it can potentially result in widespread exposures. There are many ways that contaminants can be introduced into the water system, including natural occurrences, accidents, industrial releases, and agricultural runoff (CalEPA, 2017). Low income and rural communities can be disproportionately exposed to drinking water contaminants such as nitrate from fertilizer or animal waste, pesticides, perchlorate, and arsenic.
CalEnviroscreen assigns a drinking water contamination index score to a census tract based on existing contaminant concentration levels and the presence of multiple contaminants. However, the index scores do not indicate whether water is safe to drink
within a census tract (CalEPA, 2017). According to the CalEnviroscreen 3.0 Report, California water systems have a high rate of compliance with drinking water standards (CalEPA, 2017). The State Water Resources Control Board reported that in 2014, water systems serving only about 2.9 percent of California’s population were in violation of one or more drinking water standards (SWRCB, 2016). In addition, a census tract may include many different public drinking water sources and thus, the assigned index score for a census tract may not reflect water quality existing in different portions of the census tract.
Drinking water contamination scores are shown in Figure 24. Each of the EJ Communities have a higher score than non-EJ areas.
Figure 24: Drinking Water Contamination (2005-2013)
Section titled “Figure 24: Drinking Water Contamination (2005-2013)”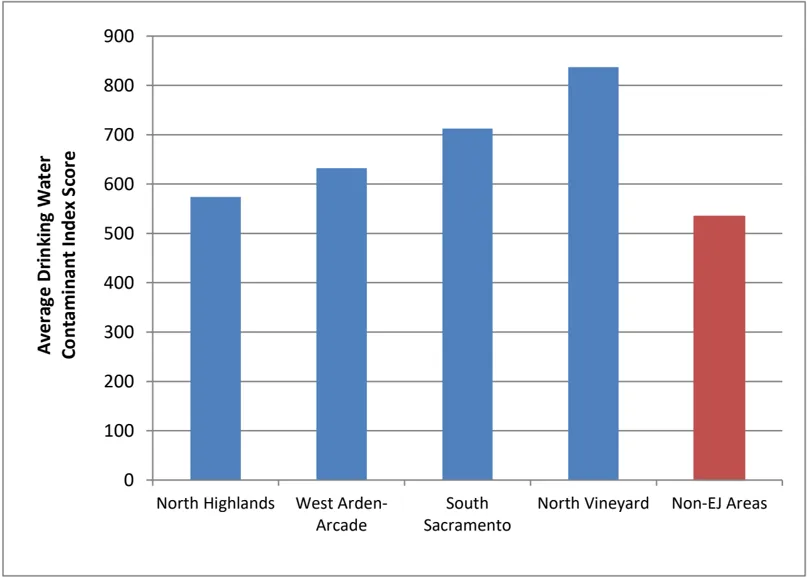
Note: North Highlands includes Foothill Farms and Old Foothill Farms
Source: CalEnviroscreen, 2017
Between 2012 and 2017, the State Water Resources Control Board cited eight water providers in unincorporated Sacramento County for violating the California Safe Drinking Water Act. Most of these were small water systems located in the Sacramento Delta. One of the remaining water providers was in the South Sacramento EJ Community while the others were in non-EJ areas. The water provider within the South Sacramento EJ Community serves approximately 7,600 residents, which is 11 percent of all residents in the South Sacramento EJ Community. Thus, unsafe drinking water is not a widespread issue within EJ Communities.
POLICIES AND IMPLEMENTATION MEASURES
Section titled “POLICIES AND IMPLEMENTATION MEASURES”CLIMATE ACTION PLAN
Section titled “CLIMATE ACTION PLAN”Objective
Section titled “Objective”Environmental Justice Communities are not disproportionately impacted by climate change.
Because of truck traffic, industrial areas often have higher levels of diesel particulate matter which can impact nearby residential neighborhoods such as this mobile home park in South Sacramento
Photo Source: Sacramento County GIS.
Intent
Section titled “Intent”Climate change includes both individual extreme events such as a flood or a heat wave and events that occur over time such as sea level rise. The impacts of climate change are already affecting many communities in California and can disproportionately affect disadvantaged areas. Many disadvantaged areas are also close to major sources of GHG emissions such as freeways, refineries and power plants.
Climate change impacts can introduce new environmental problems to EJ Communities or exasperate existing environmental problems. For example, the relatively poor air quality in Environmental Justice Communities (Figure 21) can become even worse during heat waves. The North Highlands/Foothill Farms and South Sacramento communities also do not have robust tree canopies and thus, residents in these communities are more susceptible to getting heat stroke or heat exhaustion during a heat wave.
Because Environmental Justice Communities can be more vulnerable to the effects of climate change, these communities need to be prioritized in programs that are part of the Climate Action Plan.
Policy (Environmental Justice Communities)
Section titled “Policy (Environmental Justice Communities)”EJ-28.
Section titled “EJ-28.”It is the policy of Sacramento County that programs developed as a part of a Climate Action Plan such as incentive programs, fee mitigation programs, adaptation and resiliency programs, and County-funded programs shall prioritize Environmental Justice Communities.
CONFLICTING LAND USES
Section titled “CONFLICTING LAND USES”Objective
Section titled “Objective”Sensitive receptors in residential areas are protected from exposure to air pollutants.
Intent
Section titled “Intent”When conflicting land uses are sited adjacent to each other, sensitive receptors can be exposed to pollutants from both mobile sources and stationary sources. For example, one neighborhood in the South Sacramento EJ Community is sited adjacent to several industrial land uses containing stationary sources, large arterial roadways that act as commercial truck routes, and Highway 99. This neighborhood experiences higher levels of diesel particulate matter than in other EJ Communities.
While the County desires to site sensitive receptors away from sources of pollution to the maximum extent possible, it is also the goal of the County to support transit oriented, mixed use, and infill development. Therefore, the policies and implementation measures below allow potentially conflicting land uses to be sited adjacent to each other if appropriate exposure reduction methods are incorporated with guidance from the Sacramento Metropolitan Air Quality Management District (AQMD).
Related Policies in Other Elements
Section titled “Related Policies in Other Elements”- Policies AQ-3, AQ-4A and AQ-4B in the Multidisciplinary Coordination Section of the Air Quality Element.
- Policy LU-19 in the Community and Neighborhood Identity Section of the Land Use Element.
- Policy PF-32 in the Neighborhood Integration Section of the Public Facilities Element.
- Policy HE 7.1.6 of the Housing Element.
Related Implementation Measures in Other Elements
Section titled “Related Implementation Measures in Other Elements”- Implementation Measures E, F and G in the Multidisciplinary Coordination Section of the Air Quality Element.
PREVENTING WATER CONTAMINATION
Section titled “PREVENTING WATER CONTAMINATION”Objective
Section titled “Objective”Protect drinking water in Environmental Justice Communities from contamination.
Intent
Section titled “Intent”There are systems in place that are successfully monitoring drinking water safety. The County’s Water Quality Division and the Central Valley Regional Water Quality Control Board (CVRWQCB) (regional representative of the State Water Resources Control Board) are both responsible for implementing pretreatment and monitoring programs to protect drinking water quality. The County Department of Water Resources oversees a number of stormwater quality control measures to protect surface water supplies from hazardous materials from the storm drain system. These measures have been successful in minimizing stormwater pollution impacts.
A major source of groundwater contamination are leaking underground storage tanks (LUSTs). The enforcement of the Underground Storage Tank (UST) Ordinance and various water quality monitoring programs are existing programs that have been very effective in protecting against soil and groundwater contamination from LUSTs. The County Environmental Management Department, County Water Quality and the State Department of Health Services oversee these programs. Another major source for groundwater contamination are hazardous waste sites. The State Department of Toxic Substances Control oversees the remediation of the Superfund Site at the former McClellan Air Force Base. The CVRWQCB oversees the remediation of other hazardous materials waste sites.
Because of the success of the above monitoring programs and the minimum number of water districts in EJ Communities that have been cited for water quality violations, there is no need to introduce new policies or implementation measures that are applicable to EJ Communities.
Related Policies in Other Elements
Section titled “Related Policies in Other Elements”- Policy HM-8 in the Public Health and Safety Section of the Hazardous Materials Element
- Policy HM-9 in the Public Health and Safety Section of the Hazardous Materials Element.
Related Implementation Measures in Other Elements
Section titled “Related Implementation Measures in Other Elements”- Implementation Measure A (Under Policy HM-8) in the in the Public Health and Safety Section of the Hazardous Materials Element
- Implementation Measure A (Under Policy HM-9) in the in the Public Health and Safety Section of the Hazardous Materials Element
- Implementation Measure B (Under Policy HM-9) in the in the Public Health and Safety Section of the Hazardous Materials Element
- Implementation Measure D (Under Policy HM-9) in the in the Public Health and Safety Section of the Hazardous Materials Element
ASSEMBLY BILL (AB) 617 - COMMUNITY AIR PROTECTION PROGRAM
Section titled “ASSEMBLY BILL (AB) 617 - COMMUNITY AIR PROTECTION PROGRAM”Objective
Section titled “Objective”Reduce air pollution in Environmental Justice Communities.
Intent
Section titled “Intent”AB 617 requires the California Air Resources Board (CARB) to designate high priority communities to deploy community air monitoring and/or emission reduction programs. These monitoring programs measure community exposure to air pollutants and toxic air contaminants. On September 27, 2018, CARB selected the South Sacramento-Florin community as one of ten communities across the state to be the first communities to develop and implement an AB 617 air quality monitoring plan.
The Sacramento Metropolitan Air Quality Management District (SMAQMD) has deployed air quality monitors throughout the South Sacramento-Florin community. In the future, SMAQMD is planning to recommend to CARB additional communities for AB 617 air quality monitoring. The County will consider General Plan and/or Zoning Code Amendments to support SMAQMD in meeting the AB 617 objectives.
Policy (Environmental Justice Communities)
Section titled “Policy (Environmental Justice Communities)”EJ-29.
Section titled “EJ-29.”The County will support efforts by the Sacramento Metropolitan Air Quality Management District to improve air quality in Environmental Justice Communities.
Implementation Measures (Environmental Justice Communities)
Section titled “Implementation Measures (Environmental Justice Communities)”- The County will consider General Plan and/or Zoning Code Amendments to support SMAQMD in meeting the AB 617 objectives. (PLANNING AND ENVIROMENTAL REVIEW)
- The County will encourage the Sacramento Metropolitan Air Quality Management District to recommend Environmental Justice Communities to the California Air Resources Board for AB 617 air quality monitoring. (PLANNING AND ENVIROMENTAL REVIEW)
SECTION 10: SAFE AND SANITARY HOMES
Section titled “SECTION 10: SAFE AND SANITARY HOMES”The housing conditions of older homes in a community have direct health implications for those who live in the homes. Many residents in Environmental Justice Communities live in dwellings that were built before standards and regulations were established to ensure that new homes are free from pollutants such as lead and asbestos. The proportion of older homes in Environmental Justice communities are usually higher than in non-EJ areas and thus residents in EJ Communities are disproportionately exposed to these health threats. Older housing often have other problems such as poor ventilation, which leads to uncomfortable indoor temperatures and moldproducing moisture, and pest and vermin infestation.
Overcrowded housing is another issue that affects the safety and cleanliness of homes. According to the World Health Organization, unsanitary conditions arising from overcrowding in homes can contribute to the spread of disease (California Environmental Justice Alliance, 87). Unfortunately, overcrowding is an underreported issue; however, the U.S. Census Bureau does have data to determine whether overcrowding is occurring in a neighborhood. Overcrowding is often measured by determining the persons-per-room in a dwelling unit with houses with more than one person per room.
Finally, housing affordability is another issue that influences whether homes in a community are safe and sanitary. When a tenant or homeowner spends more than 30 percent of their income toward housing (including utilities), they are generally considered to be overpaying or cost-burdened. When a household is cost-burdened, there is less money for housing maintenance or other needs such as health care and healthy food.
BASELINE CONDITIONS
Section titled “BASELINE CONDITIONS”INADEQUATE MAINTENANCE
Section titled “INADEQUATE MAINTENANCE”Age of housing stock and owner income are major factors in the need for housing maintenance. Therefore, staff developed two criteria for identifying areas (census tracts) within EJ Communities that potentially have a large number of inadequately or improperly maintained homes. The first criterion is having at least 80 percent of homes built before 1980. The second criterion is having at least 60 percent of households with annual incomes less than double the Federal poverty level.
According to Figure 25: Census Tracts in EJ Communities with Potentially Large Number of Houses Needing Maintenance, two EJ Communities (West Arden-Arcade and South Sacramento) have large areas with older homes and lower-income residents. Figure 25 also shows North Highlands/Foothill Farms having a large area of older homes but this is misleading because most of this area is comprised of the McClellan Business Park. The only other areas in the unincorporated County with older homes and lower income residents are semi-rural areas west of North Highlands and in the Sacramento Delta (Sacramento County, 2009).
Figure 25: Census Tracts in EJ Communities with Potentially Large Number of Houses Needing Maintenance
Section titled “Figure 25: Census Tracts in EJ Communities with Potentially Large Number of Houses Needing Maintenance”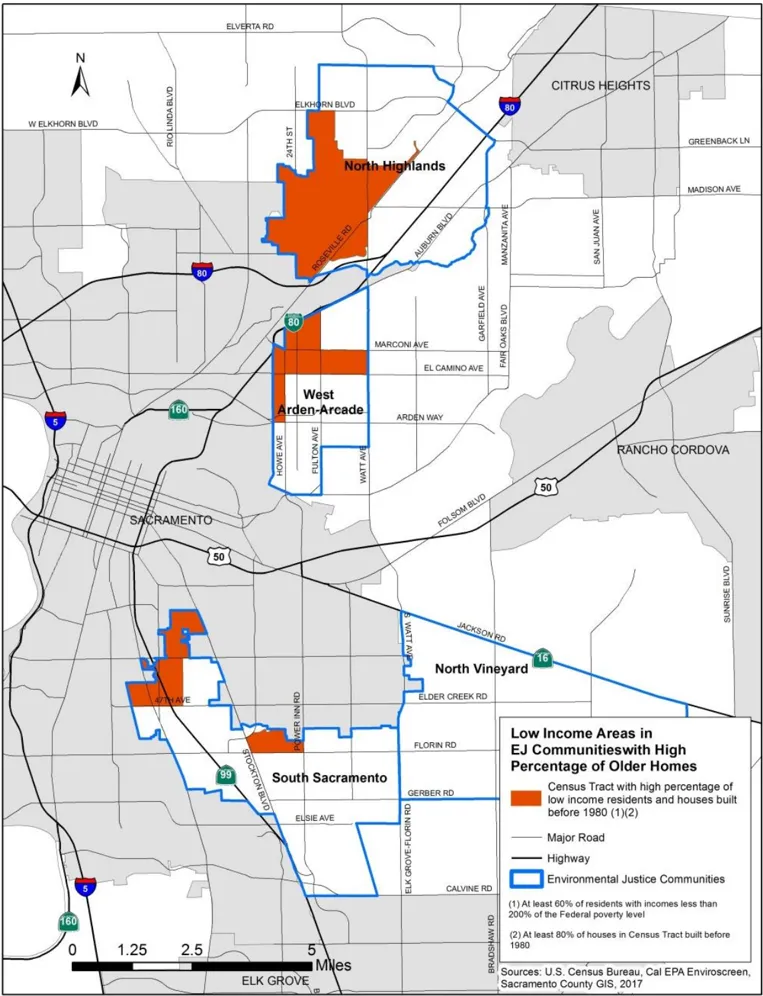
HOUSING OVERCROWDING
Section titled “HOUSING OVERCROWDING”There is a higher percentage of overcrowded homes in EJ Communities than in nonEJ areas (Figure 26). For all residences, the percentage of homes that are overcrowded in EJ communities is seven percent while in non-EJ areas the percentage is three percent. For renter-occupied residences, the percentage of homes that are overcrowded in EJ communities is ten percent compared to six percent in non-EJ areas. These percentages may not seem high but in EJ Communities, over 5,000 homes are overcrowded.
Figure 26: Percent Overcrowded Households (2012-2016)
Section titled “Figure 26: Percent Overcrowded Households (2012-2016)”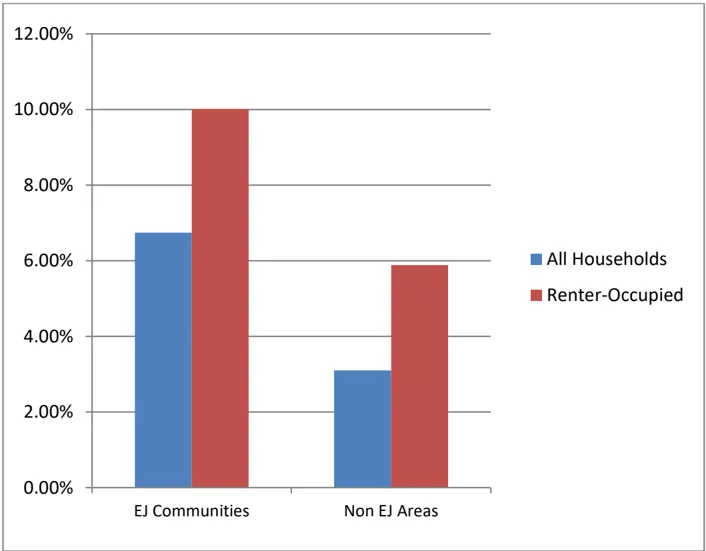
Source: U.S. Census Bureau - American Communities Survey - 5-Year Estimates, 2017
HOUSING COST-BURDENED
Section titled “HOUSING COST-BURDENED”Each of the EJ Communities have much higher rates of housing cost-burdened households than non-EJ areas (Figure 27). Among the EJ Communities, West ArdenArcade has the highest percentage of cost-burdened households (26.4%) while North Highlands/Foothill Farms has the lowest percentage (21.3%). In contrast, in Non-EJ areas, the percentage of housing cost-burdened households is only 15.5 percent.
Figure 27: Percent Housing Cost Burdened Households (2009-2013)
Section titled “Figure 27: Percent Housing Cost Burdened Households (2009-2013)”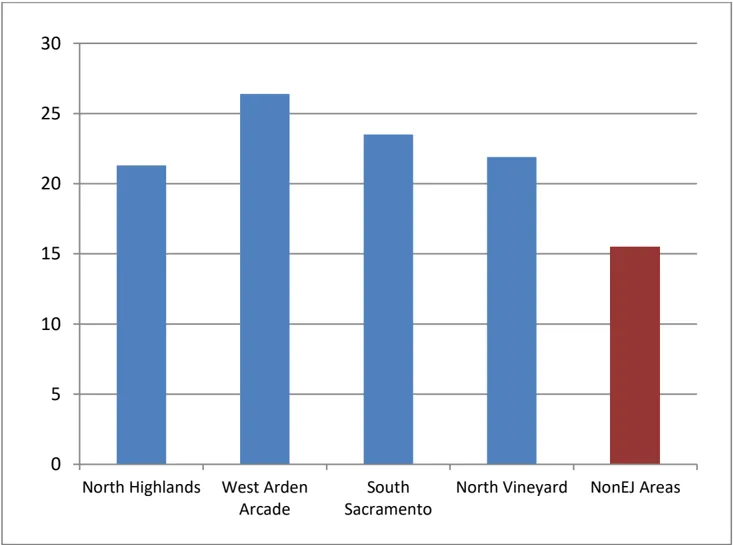
Note: North Highlands includes Foothill Farms/Old Foothill Farms.
Source: CalEnviroscreen, 2017.
One way to reduce percentages of housing cost-burdened households is to provide more affordable housing. However, during the last five years, only two affordable housing projects have been built which resulted in 193 affordable rental units (Table 6).
Table 6: Affordable Housing Projects Built 2014-2018
Section titled “Table 6: Affordable Housing Projects Built 2014-2018”| Apartment Name | Community | Year Built | Affordable Units |
|---|---|---|---|
| Anton Butano | Arden-Arcade | 2015 | 147 |
| Sutter Place | Carmichael | 2016 | 46 |
POLICIES AND IMPLEMENTATION MEASURES
Section titled “POLICIES AND IMPLEMENTATION MEASURES”HOUSING MAINTENANCE
Section titled “HOUSING MAINTENANCE”Objective
Section titled “Objective”All homeowners or renters who need help in maintaining their homes could receive the help they need through government and non-profit programs.
Intent
Section titled “Intent”Insufficiently maintained housing often leads to health effects from unsafe and unsanitary conditions such as pest infestation, mold, water intrusion, physical damage and exposure to toxins such as asbestos and lead. Thus, there is a need for General Plan policies and programs that will assist those who want to mitigate or remove these conditions. The Housing Element has two policies (HE 3.1.1, HE 3.1.2) that encourage
the rehabilitation of substandard homes occupied by lower income households. In addition, the Housing Element has an implementation program C2 that requires the Sacramento Housing and Redevelopment Agency (SHRA) provide financial assistance for emergency repairs and disabled retrofits for low income or senior residents.
SHRA administers or financially assists two programs that help low-income homeowners. The Emergency Repair Program/Accessibility Modifications (ERP-A) program administered by SHRA provides home repair assistance to very low-income homeowners within the unincorporated County. SHRA also provides financial assistance to Rebuilding Together to operate the Safe at Home Program. This program provides free minor modifications and repairs to low income homeowners. There are also private organizations that provide housing maintenance programs. The Low Income Weatherization Program administered by Community Resource Project, Inc. assists lower income households by providing new appliances and energy saving home improvements.
For rental units, tenants can make anonymous complaints to Code Enforcement regarding housing maintenance issues and a Code Enforcement officer will respond to the complaint. To resolve the issue, the property owner will have to make the necessary corrections. There is also the Rental Inspection Program where there are proactive inspections of rental properties that have had prior complaints and selfcertification for other properties. Finally, there is the Childhood Lead Poisoning Prevention Program where the Department of Health Services refers properties to Environmental Management for lead removal.
Policy (EJ Communities)
Section titled “Policy (EJ Communities)”EJ-30.
Section titled “EJ-30.”Encourage the rehabilitation and preservation of substandard homes owned/occupied by lower income households in Environmental Justice Communities.
Implementation Measure (Countywide)
Section titled “Implementation Measure (Countywide)”- The County will continue the Childhood Lead Poisoning Prevention Program. (HEALTH SERVICES, ENVIRONMENTAL MANAGEMENT)
Implementation Measure (EJ Communities)
Section titled “Implementation Measure (EJ Communities)”- Assist in promoting the Low Income Weatherization Program in Environmental Justice Communities. Applicants who qualify for the program could receive certain improvements at no cost. Improvements include heaters/air conditioners, solar panels, water heaters, new windows and glass repair, weatherization and attic and floor insulation. (PLANNING AND ENVIRONMENTAL REVIEW)
Related Implementation Measures in Other Elements
Section titled “Related Implementation Measures in Other Elements”- Program C2 (Emergency Repairs and Disabled Retrofit for Homes) in the Housing Element
- Program C8 (Rental Inspection Program) in the Housing Element
HOUSING OVERCROWDING
Section titled “HOUSING OVERCROWDING”Objective
Section titled “Objective”Eliminate or reduce housing overcrowding in Environmental Justice Communities.
Intent
Section titled “Intent”There are many situations and complex factors that cause housing overcrowding. This includes the mismatch between the cost of housing and household income and
different levels of tolerance in living in cramped situations. Regardless of these factors, overcrowding often occurs in the following situations:
- A large family lives in a small unit
- A family provides accommodations for extended family (doubling up)
- A family rents space to nonfamily members
- Students double up to afford housing
Housing overcrowding often involves the inability of lower income large and very-large households to find affordable housing that is large enough for their housing needs. Thus, the presence of overcrowded households is usually an indicator of the lack of affordable housing.
Policy (EJ Communities)
Section titled “Policy (EJ Communities)”EJ-31.
Section titled “EJ-31.”Support the development of housing to meet the needs of large households in Environmental Justice Communities, particularly those who are refugees or immigrants.
Implementation Measures (EJ Communities)
Section titled “Implementation Measures (EJ Communities)”- As part of its analysis for the next Housing Element, the Office of Planning and Environmental Review (PER) will do an in-depth analysis of the presence of housing overcrowding in Environmental Justice Communities and the causes of that overcrowding. (PLANNING AND ENVIRONMENTAL REVIEW)
- Collaborate with refugee and immigrant advocates to determine the extent of housing overcrowding Environmental Justice Communities. Determine implementation measures to decrease housing overcrowding which can be added to the 2021 Housing Element. (PLANNING AND ENVIRONMENTAL REVIEW)
HOUSING AFFORDABILITY
Section titled “HOUSING AFFORDABILITY”Objective
Section titled “Objective”Construct additional affordable housing units in each of the Environmental Justice Communities and reduce the percentage of cost-burdened households.
Intent
Section titled “Intent”For California households, housing is often the greatest single expense with costburdened households paying more than 30 percent of their income toward housing. The median price of a home in Sacramento County has steadily increased since the end of the Great Recession and has exceeded $300,000 in 2018. The impact of increasing housing costs falls disproportionally on lower income households, especially renters. Higher income households can adjust to higher housing costs by spending more of their income on housing but lower income households cannot make this adjustment without reducing expenditures in other essentials such as health care and food.
To reduce the number of lower income households that are cost-burdened, more housing must be provided that will result in these households not spending more than 30 percent of their income on housing costs. However, this cannot be addressed by depending on the housing market. There is a need for a number of local government actions to encourage the provision of affordable housing. One such action is to reduce development impact fees for affordable housing and/or reduce processing times for project review. Another action is the establishment of an affordable housing program that requires the construction of affordable housing or the payment of an affordable housing fee. The County’s Affordable Housing Program was adopted in 2014 and it requires builders to pay an affordable housing fee for each market-rate unit. This fee is used to financially support the production of affordable housing units. However,
since 2014 only two affordable housing projects with a total of 193 affordable units has been constructed (Table 6). For this reason, the Office of Planning and Environmental Review and the Sacramento Housing and Redevelopment Agency will review the Affordable Housing Program as part of the 2021 Housing Element Update.
Policy
Section titled “Policy”EJ-32.
Section titled “EJ-32.”The County will support the provision of affordable housing in Environmental Justice Communities.
Implementation Measures (Countywide)
Section titled “Implementation Measures (Countywide)”- The Office of Planning and Environmental Review and Sacramento Housing and Redevelopment Agency will review the Affordable Housing Program and Ordinance for potential changes that could assist in producing more housing that is affordable to lower income households. (PLANNING AND ENVIRONMENTAL REVIEW, SACRAMENTO HOUSING AND REDEVELOPMENT AGENCY)
- Develop guidelines for affordable housing developers to attain support for their projects through public outreach. These guidelines could be part of the Countywide Public Outreach Strategy. (PLANNING AND ENVIRONMENTAL REVIEW)
Implementation Measures (EJ Communities)
Section titled “Implementation Measures (EJ Communities)”- Develop an impact fee reduction program for residential developments in Environmental Justice Communities in which at least 10 percent of the total units are affordable to very low-income households or at least 49 percent are affordable to low-income households and on which affordability restrictions are subject to long-term (30 years or greater) regulatory agreements as certified by the Sacramento Housing and Redevelopment Agency (SHRA). (PLANNING AND ENVIRONMENTAL REVIEW)
SECTION 11: IMPLEMENTATION
Section titled “SECTION 11: IMPLEMENTATION”The County will utilize two strategies for implementation of the Environmental Justice Element. The first comprises the prioritization and implementation of the policies and measures contained in the EJ Element. The second strategy is a systems approach consisting of changes to the regular processes and practices of the County.
POLICIES AND IMPLEMENTATION MEASURES
Section titled “POLICIES AND IMPLEMENTATION MEASURES”Objective
Section titled “Objective”Effectively implement environmental justice in the unincorporated County.
Policies (Countywide)
Section titled “Policies (Countywide)”EJ-33.
Section titled “EJ-33.”There will be an annual implementation review for the Environmental Justice Element.
EJ-34.
Section titled “EJ-34.”The County will embed environmental justice into its regular processes and practices.
Implementation Measures (Countywide)
Section titled “Implementation Measures (Countywide)”- The following process will be implemented annually in order to effectively carry out the policies and implementation measures in the Environmental Justice (EJ) Element:
- Annual Stakeholder Meeting: The County will provide stakeholders the opportunity to inform the County of their implementation priorities for the following year.
- Executive Level Working Group: This group will consist of department directors and will use Annual Stakeholder Meeting comments to inform implementation decisions and resource commitments. The Working Group will focus on implementation measures that involve multiple County departments.
- Long Range Planning (LRP) Section of the Office of Planning and Environmental Review (PER): This section will also use Annual Stakeholder meeting comments to inform implementation decisions and resource commitments. The LRP Section will focus on measures that are the sole responsibility of PER and will provide staff to work on major and/or multidepartment implementation measures supported by the Executive Level Working Group.
- Report Card on EJ Element Implementation: PER Long Range Planning staff will track EJ Element implementation and will create a 'report card' that will document EJ Element implementation for the previous calendar year. This 'report card' will be part of the General Plan Annual Report and will be made available to the public on PER's website in addition to the regular practice of presenting it in public session to the Planning Commission and Board of Supervisors. (PLANNING AND ENVIRONMENTAL REVIEW, OTHER COUNTY DEPARTMENTS)
- The Office of Planning and Environmental Review (PER) will train its staff to analyze development projects using environmental justice principles. PER will train other County departments, particularly high-level managers, on incorporating environmental justice into their regular processes and practices. (PLANNING AND ENVIRONMENTAL REVIEW)
REFERENCES
Section titled “REFERENCES”- Altingdag, Duha T. (2009). Crime and Unemployment: Evidence from Europe. 2011. Auburn University Department of Economics Working Paper Series. Available: https://cla.auburn.edu/econwp/Archives/2011/2011-13.pdf
- Anderson S. (1990). The 1990 Life Sciences Research Office (LSRO) Report on Nutritional Assessment Defined Terms Associated with Food Access. Core Indicators of Nutritional State for Difficult to Sample Populations.
- California Air Resources Board. Summary: Diesel Particulate Matter Health Impacts. Available: https://ww2.arb.ca.gov/resources/summary-diesel-particulatematter-health-impacts
- California Environmental Justice Alliance, Placeworks (2017). SB 1000 Implementation Toolkit Planning for Healthy Communities.
- CalEPA (2017) California Environmental Protection Agency. CalEnviroScreen 3.0. Available: https://oehha.ca.gov/media/downloads/calenviroscreen/report /ces3report.pdf
- City of National City (2012). National City General Plan, Health and Environmental Justice Element (HEJ). Available: http://www.nationalcityca.gov/home/showdocument?id=5220
- City of Portland (OR) (2015). Exhibit A: City of Portland CPTED Definition and Policy Strategies. Available: https://www.portlandoregon.gov/citycode/article/272978
- EPA. United States Environmental Protection Agency. Health Effects of Ozone Pollution. Available: https://www.epa.gov/ozone-pollution/health-effectsozone-pollution
- Gruenewald, Paul J., Lillian Remer (2006). Changes in Outlet Densities Affect Violence Rates. Alcoholism Clinical and Experimental Research. Vol. 30, Issue 7, 1184-1193.
- LPC Consulting Associates, Inc. (2018). Crime and Safety Data Profiles (For ArdenArcade, North Highlands/Foothill Farms and South Sacramento) For Black Child Legacy Campaign. Available: http://blackchildlegacy.org/neighborhoods/
- Lin, Ming-Jen (2008). Does Unemployment Increase Crime? Evidence from U.S. Data 1974-2000. Human Resources , Spring 2008 vol. 43 no. 2 413-436.
- Raphael, Steven, Rudolf Winter-Ebmer (2001). Identifying the Effect of Unemployment on Crime. The Journal of Law & Economics, Vol. 44, No. 1 (April 2001), 259-283.
- Sacramento Area Council of Governments (2016). 2016 Metropolitan Transportation Plan/Sustainable Communities Strategy.
- Sacramento County General Plan. (2011).
- Sacramento County Office of Planning and Environmental Review (2009). Exterior Housing Condition Survey.
- Roman, Caterina G., Shannon E. Reid, Avinash S. Bhati, Bogdan Tereschenko (2008). Alcohol Outlets as Attractors of Violence and Disorder: A Closer Look at the Neighborhood Environment. Urban Institute Justice Policy Center. Available: https://www.urban.org/sites/default/files/publication/31701/411663-AlcoholOutlets-as-Attractors-of-Violence-and-Disorder.PDF
- Scribner, Richard A., David P. MacKinnon, James H. Dwyer (1995). The Risk of Journal of Public Health, Vol. 85, 335-340. Available:
- Assaultive Violence and Alcohol Availability in Los Angeles County. American http://www.public.asu.edu/~davidpm/classes/publications/1995AmericanJou rnalofPublicHealth.pdf
- Stewart, Katheryn. How Alcohol Outlets Affect Neighborhood Violence. Prevention Research Center, Pacific Institute for Research and Evaluation. Available: http://resources.prev.org/documents/AlcoholViolenceGruenewald.pdf
- SWRCB (2016). State (California) Water Resources Control Board. 2014 Annual Compliance Report. Available: http://www.waterboards.ca.gov/drinking\_water/certlic/driinkingwater/docum ents/dwdocuments/2014/2014_acr_final.pdf.
- Trust for America’s Health (2017). The State of Obesity. Available: https://www.tfah.org/report-details/the-state-of-obesity-2017/
- United States Department of Health and Human Services: Office of the Assistant Secretary for Planning and Evaluation (2009). Physical Activity Fundamental to Preventing Disease.
- Youth.Gov Benefits for Youth, Families and Communities. Available: https://youth.gov/youth-topics/afterschool-programs/benefits-youth-familiesand-communities
APPENDIX A-1: POP-UP BOOTH SURVEY SUMMARIES
Section titled “APPENDIX A-1: POP-UP BOOTH SURVEY SUMMARIES”CRIME PREVENTION
Section titled “CRIME PREVENTION”Do you feel safe getting around your neighborhood?
North Highlands/Foothill Farms
| ZIP Code | Yes | No | Somewhat | No Response | Response Total |
|---|---|---|---|---|---|
| North Highlands/Foothill Farms | 95842 | 5 | 4 | 6 | 0 |
| North Highlands/Foothill Farms | 95660 | 10 | 13 | 8 | 4 |
| Total | 15 | 17 | 14 | 4 | 46 |
| Percent of Total | 32.6% | 37.0% | 30.4% |
South Sacramento
| ZIP Code | Yes | No | Somewhat | No Response | Response Total |
|---|---|---|---|---|---|
| 95823 | 7 | 3 | 4 | 3 | 14 |
| 95824 | 1 | 1 | 1 | 0 | 3 |
| 95828 | 7 | 2 | 5 | 2 | 14 |
| Total | 15 | 6 | 10 | 5 | 31 |
| Percent of Total | 48.4% | 19.4% | 32.3% |
Arden-Arcade
| ZIP Code | Yes | No | Somewhat | No Response | Response Total |
|---|---|---|---|---|---|
| Arden-Arcade | 95821 | 3 | 7 | 4 | 3 |
| Arden-Arcade | 95825 | 4 | 5 | 2 | 4 |
| Total | 7 | 12 | 6 | 7 | 25 |
| Percent of Total | 28.0% | 48.0% | 24.0% |
Respondent’s Comments
Section titled “Respondent’s Comments”Arden-Arcade
Section titled “Arden-Arcade”- Many homeless people. (95821)
- Sometimes I feel endangered - hear fighting/gunshots. (Eleven-year old.) (95821)
- Many homeless traverse through neighborhood looking for opportunities. Would love to see more Sheriff’s presence. (95821)
- The homeless population is growing as it is everywhere - but it is not great for walking in our neighborhood. (95821)
- I do not walk by myself. I always walk with my dogs or someone else. (95821)
- It was better but now too many homeless. (95825)
North Highlands/Foothill Farms
Section titled “North Highlands/Foothill Farms”- Lots of violence and speeders. (95660)
- Too many homeless. (95660)
- Mixed feeling. Not safe for all. (95660)
- Shooting at Madison Apartments. (95660)
- No, I fear for my family’s safety. (95842)
- Shooting on Don Julio. (95842)
South Sacramento
Section titled “South Sacramento”- Yes during day. No at night. A lot of homeless people in the area. (95823)
- I think we can have more security/police here. (95823)
- Would not walk at night. (95828)
- There is a lot of crime in my neighborhood. (95828)
- Need more visible police presence. Need more security in neighborhood. (95828)
- In nearby creek there is litter. Homeless sleep and camp out in this area. Drug abuse. (95828)
Where in your neighborhood you do not feel safe?
Arden-Arcade
Section titled “Arden-Arcade”- Watt and Marconi. (95821)
- Everywhere. (95821)
- My neighborhood. (95821)
- Close to Edison Avenue. (95821)
- Arden-Arcade/Marconi Ave. Area. (95821)
- Watt Avenue - Traffic and crime issues. (95821)
- At times - Cottage Park. (95821)
- The streets surrounding my neighborhood. (95821)
- Bell Street, parks. (95825)
- Near El Camino/’Howe - 99 Cents Store. (95825)
- At night on streets and west of Fulton/Edison. (95825)
- Wittkop Way. (95825)
- All around Kaiser Morse. (Works here) (95825)
- Around the hospital (Kaiser Morse), grocery store on Watt. (95825)
North Highlands/Foothill Farms
Section titled “North Highlands/Foothill Farms”- Entire area. (95660)
- Everywhere. (95660)
- Watt Avenue - Too much drug, prostitution activity. (95660)
- Liquor store near apartments. (95660)
- Parking lot near Planet Fitness. (95660)
- Neighborhood after dark. (95660)
- Local parks. (95660)
Sacramento County Environmental Justice Element
Section titled “Sacramento County Environmental Justice Element”- North Highlands. (95660)
- Watt Avenue - McDonalds/Taco Bell. People post outside and beg. (95660)
- Walerga/Elkhorn (99 Cents Store). (95660)
- Everywhere. (95660)
- All over without streetlights. (95660)
- Watt Avenue. (95660)
- Watt Avenue/Myrtle Ave. (95660)
- Watt Avenue/A Street/Freedom Park. (95660)
- Karl Drive. (95660)
- Anywhere in the dark - lol. (95660)
- Myrtle/Watt - Pimps/Prostitutes. (95660)
- 99 Cents Store - Walerga/Elkhorn. (95660)
- Anywhere. (95660)
- This area. (95660)
- Store, Food Max. (95660)
- On streets at night. Lots of homeless people. (95842)
- Greenholme. (95842)
- Arbys/99 Cents Store Shopping Center. (95842)
- Parking lot at 99 Cents Store. (95842)
- Everywhere. (95842)
- Park. (95842)
- Not when I am in my neighborhood. (95842)
- Elkhorn Blvd. - homeless. (95842)
- My parking lot. (95842)
South Sacramento
Section titled “South Sacramento”- By empty field where all the homeless people stay. Very Dirty. (95823)
- Whole neighborhood. (95823)
- Everywhere. (95823)
- Everywhere. (95823)
- Around major roads. (95824)
- Franklin Boulevard. (95824)
- My neighborhood. (95828)
- Nearby creek. (95828)
HEALTHY FOOD ACCESS
Section titled “HEALTHY FOOD ACCESS”Is it easy for you to get and eat fresh fruits and vegetables?
North Highlands/Foothill Farms
| Zip Code | Yes | No | Somewhat | No Response | Total Responses |
|---|---|---|---|---|---|
| 95842 | 10 | 2 | 1 | 2 | 13 |
| 95660 | 25 | 3 | 4 | 4 | 32 |
| Total | 35 | 5 | 5 | 6 | 51 |
| Percent of Total | 77.8% | 11.1% | 11.1% |
South Sacramento
| Zip Code | Yes | No | Somewhat | No Response | Total Responses |
|---|---|---|---|---|---|
| 95823 | 13 | 2 | 0 | 2 | 15 |
| 95824 | 1 | 3 | 0 | 1 | 4 |
| 95828 | 9 | 2 | 4 | 0 | 15 |
| Total | 23 | 7 | 4 | 34 | |
| Percent of Total | 67.6% | 20.6% | 11.8% |
Arden-Arcade
| Zip Code | Yes | No | Somewhat | No Response | Total Responses |
|---|---|---|---|---|---|
| 95821 | 10 | 5 | 1 | 1 | 16 |
| 95825 | 11 | 1 | 0 | 5 | 12 |
| Total | 21 | 6 | 1 | 28 | |
| Percent of Total | 75.0% | 21.4% | 3.6% |
Respondent’s Comments
Section titled “Respondent’s Comments”Arden-Arcade
Section titled “Arden-Arcade”- Yes! Love the smaller fruit and veggie sellers - Even fruit at 99 Cents Store (Bell and El Camino). (95821)
- Yes, only because Kaiser has a farmer’s market on Fridays. (Works at Kaiser 95825)
- It is expensive - Walmart. I go shopping at the 99 Cents Store but it is not fresh. (95821)
- They could open a farmer’s market on a weekday that closes later. (95821)
- Yes, plenty of supermarkets and yet I feel I live in a ‘food desert’ when it comes to healthy options. (95821)
- No, I get them from supermarkets, there are not so many around my neighborhood. (95821)
- It is easy to eat unhealthy food because it is cheaper. Fruits and veggies are too expensive. (95821)
- We could use another market! (95821)
North Highlands/Foothill Farms
Section titled “North Highlands/Foothill Farms”- Food desert. Go to farmer’s markets in downtown and Roseville. (95660)
- No, only Walmart available. (95660)
- Yes, but it tends to be more expensive. (95660)
- Not always - disabled. (95660)
- Store not always the cheapest. (95660)
- Wish there were more stores. (95842)
South Sacramento
Section titled “South Sacramento”- Yes, grocery stores and farmers market very close. (95823)
- The prices for fruits and veggies are more than chips and candy. (95824)
- Best location for shopping (Calvine/Power Inn area). (95828)
- Not many options - Fruitridge - not much on either way on Fruitridge. (95824)
Where do you get your fresh fruits and vegetables?
North Highlands/Foothill Farms
| ZIP Code | # Respondents Identified Source | Supermarket | Small Grocer | Ethnic Market | Discount (99 Cents) | Farmers Market/Flea Market | Distribution Center | Private Garden or Food Delivery |
|---|---|---|---|---|---|---|---|---|
| 95842 | 11 | 10 | 2 | 0 | 0 | 2 | 2 | 2 |
| 95660 | 28 | 24 | 4 | 1 | 0 | 7 | 2 | 1 |
| Total # of Respondents | 39 | 34 | 6 | 1 | 0 | 9 | 4 | 3 |
| Percent Respondents | 87.2% | 15.4% | 2.6% | 0.0% | 23.1% | 10.3% | 7.7% |
South Sacramento
| ZIP Code | # Respondents Identified Source | Supermarket | Small Grocer | Ethnic Market | Discount (99 Cents) | Farmers Market/Flea Market | Distribution Center | Private Garden or Food Delivery |
|---|---|---|---|---|---|---|---|---|
| 95823 | 12 | 12 | 0 | 1 | 0 | 3 | 1 | 1 |
| 95824 | 3 | 4 | 0 | 0 | 1 | 1 | 0 | 0 |
| 95828 | 15 | 13 | 0 | 1 | 0 | 3 | 0 | 0 |
| Total # of Respondents | 30 | 29 | 0 | 2 | 1 | 7 | 1 | 1 |
| Percent Respondents | 96.7% | 0.0% | 6.7% | 3.3% | 23.3% | 3.3% | 3.3% |
Arden-Arcade
| ZIP Code | # Respondents Identified Source | Supermarket | Small Grocer | Ethnic Market | Discount (99 Cents) | Farmers Market/Flea Market | Distribution Center | Private Garden or Food Delivery |
|---|---|---|---|---|---|---|---|---|
| 95821 | 12 | 9 | 1 | 0 | 3 | 7 | 0 | 1 |
| 95825 | 12 | 8 | 1 | 0 | 0 | 4 | 0 | 1 |
| Total # of Respondents | 24 | 17 | 2 | 0 | 3 | 11 | 0 | 2 |
| Percent Respondents | 70.8% | 8.3% | 0.0% | 12.5% | 45.8% | 0.0% | 8.3% |
PHYSICAL ACTIVITY
Section titled “PHYSICAL ACTIVITY”Can you access places you want to go by bicycling or cycling?
North Highlands/Foothill Farms
| Zip Code | Yes | No | Somewhat | No Response | Response Total |
|---|---|---|---|---|---|
| 95842 | 7 | 5 | 1 | 1 | 13 |
| 95660 | 21 | 9 | 1 | 3 | 31 |
| Total | 28 | 14 | 2 | 4 | 48 |
| Percent of Total | 58.3% | 29.2% | 4.2% |
South Sacramento
| Zip Code | Yes | No | Somewhat | No Response | Response Total |
|---|---|---|---|---|---|
| 95823 | 13 | 2 | 1 | 0 | 16 |
| 95824 | 3 | 0 | 0 | 0 | 3 |
| 95828 | 16 | 1 | 1 | 1 | 19 |
| Total | 32 | 3 | 2 | 1 | 38 |
| Percent of Total | 84.2% | 7.9% | 5.3% |
Arden-Arcade
| Zip Code | Yes | No | Somewhat | No Response | Response Total |
|---|---|---|---|---|---|
| 95821 | 7 | 8 | 0 | 2 | 15 |
| 95825 | 10 | 3 | 0 | 0 | 13 |
| Total | 17 | 11 | 0 | 2 | 30 |
| Percent of Total | 56.7% | 36.7% | 0.0% |
Respondent’s Comments
Section titled “Respondent’s Comments”North Highlands/Foothill Farms
Section titled “North Highlands/Foothill Farms”- Everything is motor geared. (95660)
- More bike trails. Not riding on busy streets.(95660)
- Bike lanes not in great condition. (95660)
- Walerga needs sidewalks. (95660)
- Don’t walk - not safe. (95660)
- Not too great. Always have to drive. (95842)
- If you are not going very far. It would be very nice if kept clean and drug free. (95842)
South Sacramento
Section titled “South Sacramento”- Do not feel safe using bike lanes. (95823)
- Need for bike lanes. (95823)
- More walking trails are needed. (95823)
- Drivers drive on the bike lane. (95823)
Arden-Arcade
Section titled “Arden-Arcade”-
I cannot access because of the condition and dangers of the road. (95821)
-
Riding a bike in Arden is scary. Cars travel too fast, feel constantly in danger. (95821)
-
I feel boxed in when it comes to taking a relaxing walk. Need walking trails. (95821)
-
We need sidewalks!!! This is a huge problem here - entire neighborhoods with no sidewalks! We also need bike lanes! (95825)
-
Want more walking trails. (95825)
-
More bike lanes would be awesome. Especially on our busier streets such as Watt, El Camino, Marconi, Fulton. (95825)
-
Bike lanes to American River Bike Path. Sidewalks on Wyda Way. (95825)
POLLUTION EXPOSURE
Section titled “POLLUTION EXPOSURE”Do you feel that the air your breathe needs to be improved? Note: Only tabulated answers that distinguished between water and air.
North Highlands/Foothill Farms
| Zip Code | Yes | No | Somewhat | Total |
|---|---|---|---|---|
| 95842 | 4 | 2 | 1 | 7 |
| 95660 | 9 | 4 | 13 | |
| Total | 13 | 6 | 1 | 20 |
| Percent of Total | 65.0% | 30.0% | 5.0% |
South Sacramento
| Zip Code | Yes | No | Somewhat | Total |
|---|---|---|---|---|
| 95823 | 5 | 2 | 7 | |
| 95824 | 1 | 1 | ||
| 95828 | 3 | 2 | 5 | |
| Total | 9 | 4 | 0 | 13 |
| Percent of Total | 69.2% | 30.8% | 0.0% |
Arden-Arcade
| Zip Code | Yes | No | Somewhat | Total |
|---|---|---|---|---|
| 95821 | 4 | 4 | ||
| 95825 | 4 | 1 | 5 | |
| Total | 8 | 1 | 0 | 9 |
| Percent of Total | 88.9% | 11.1% | 0.0% |
Respondent’s Comments
Section titled “Respondent’s Comments”North Highlands/Foothill Farms
Section titled “North Highlands/Foothill Farms”- Air is better than New York City. (95660)
- Can’t do anything about air quality. (95660)
- Disgusting and muggy. (95660)
- Air is bad. (95660)
- Good air. (95660)
Sacramento County Environmental Justice Element
Section titled “Sacramento County Environmental Justice Element”- No, maybe air. (95842)
- Air - OK except for fires. (95842)
- Yes - a lot. Cigarette smoke, dust. (95842)
- Yes, the air is very polluted. (95842)
South Sacramento
Section titled “South Sacramento”- Air needs the attention. (95823)
- I feel it needs to improve. (95823)
- Air - great. (95828)
- Yes, I have asthma. (95828)
- Air quality needs improvement - asthmatic. (95828)
Arden-Arcade
Section titled “Arden-Arcade”- Air depends on weather. (95821)
- Not the water but we need to do something with the air pollution (Age 11). (95821)
- Air quality is mediocre next to 80 and McClellan Field. (95821)
- Yes I do, air especially. (95821)
- I think they are good but there is always room for improvement. Car exhaust is a big problem - too many cars! (95825)
- Air could be better. (95825)
- Air usually OK. (95825)
- Air yes - all of California does. (95825)
SAFE AND SANITARY HOMES
Section titled “SAFE AND SANITARY HOMES”Could you adequately keep your house in good condition?
North Highlands/Foothill Farms
| Zip Code | Yes | No | Somewhat | No Response | Response Total |
|---|---|---|---|---|---|
| 95842 | 31 | 14 | 10 | 12 | 55 |
| 95660 | 27 | 3 | 2 | 3 | 32 |
| Total | 58 | 17 | 12 | 15 | 87 |
| Percent of Total | 66.7% | 19.5% | 13.8% |
South Sacramento
| Zip Code | Yes | No | Somewhat | No Response | Response Total |
|---|---|---|---|---|---|
| 95823 | 12 | 1 | 1 | 1 | 14 |
| 95824 | 1 | 2 | 0 | 0 | 3 |
| 95828 | 14 | 2 | 0 | 0 | 16 |
| Total | 27 | 5 | 1 | 33 | |
| Percent of Total | 81.8% | 15.2% | 3.0% |
Arden-Arcade
| Zip Code | Yes | No | Somewhat | No Response | Response Total |
|---|---|---|---|---|---|
| 95821 | 13 | 2 | 0 | 2 | 15 |
| 95825 | 8 | 0 | 0 | 6 | 8 |
| Total | 21 | 2 | 0 | 23 | |
| Percent of Total | 91.3% | 8.7% | 0.0% |
Respondents’ Comments
Section titled “Respondents’ Comments”North Highlands
Section titled “North Highlands”- Stated he is not in good enough physical condition to maintain his home.
- Need help. (95842)
- Apartments not well maintained. (95842)
- It is difficult to keep my house up considering my property management does not do anything. (95842)
South Sacramento
Section titled “South Sacramento”- Maybe not plumbing. (95823)
- Flooring. (95823)
Arden-Arcade
Section titled “Arden-Arcade”- I would if I had more money. (95821)
What is the condition of homes in your neighborhood?
North Highlands/Foothill Farms
| Zip Code | Good | Fair | Bad | No Response | Response Total |
|---|---|---|---|---|---|
| 95842 | 31 | 14 | 10 | 12 | 55 |
| 95660 | 50 | 24 | 4 | 5 | 78 |
| Total | 81 | 38 | 14 | 17 | 133 |
| Percent of Total | 60.9% | 28.6% | 10.5% |
South Sacramento
| Zip Code | Good | Fair | Bad | No Response | Response Total |
|---|---|---|---|---|---|
| 95823 | 8 | 3 | 0 | 4 | 11 |
| 95824 | 1 | 1 | 1 | 0 | 3 |
| 95828 | 7 | 5 | 3 | 1 | 15 |
| Total | 16 | 9 | 4 | 29 | |
| Percent of Total | 55.2% | 31.0% | 13.8% |
Arden-Arcade
| Zip Code | Good | Fair | Bad | No Response | Response Total |
|---|---|---|---|---|---|
| 95821 | 7 | 6 | 1 | 4 | 14 |
| 95825 | 4 | 1 | 1 | 7 | 6 |
| Total | 11 | 7 | 2 | 11 | 20 |
| Percent of Total | 55.0% | 35.0% | 10.0% |
Respondents’ Comments
Section titled “Respondents’ Comments”North Highlands
Section titled “North Highlands”- Older homes, some refurbished. (95660)
- The majority are decent. We have one abandoned home on Lynhurst that needs major attention. (95660)
- Up and down. 3/4 are owned and are good, 1/4 rentals. (95660)
- Fair but on the rise as old people die or go to nursing homes and the new people upgrade to acceptable. (95660)
- Excellent - new. (95660)
- Not worth the rent! (95660)
- It is pretty good. Everyone does their part to keep it clean. (95842)
- Mostly good (gated trailer park). (95842)
- Very poor, dirty. Streets are covered in trash and junkies. I can’t walk outside without someone trying to sell me drugs. (95842)
South Sacramento
Section titled “South Sacramento”- Apartments are clean. Streets, sidewalk - not so clean due to homeless. (95823)
- Crazy things - my neighbor is crazy - shooting and fighting. (95823)
- Good and well kept. (95823)
- Lack of assistance. (95824)
- Needs work - homeowners need to fix. (95828)
- Rentals - bad. Few homeowners left. (95828)
West Arden-Arcade
Section titled “West Arden-Arcade”- I live in a historic neighborhood of Strizek homes, but the County has no historic preservation ordinance. So they could be demolished at the whim of an owner. Our local history needs to be recognized and protected. (95825)
- Mostly very good - a few drug houses. The apartments around Howe and Wyda are ghetto. (95825)
- In 95825, there are many unkept homes and yards. (95825)
APPENDIX A-2: SUMMARIES OF WEB SURVEY RESPONSES
Section titled “APPENDIX A-2: SUMMARIES OF WEB SURVEY RESPONSES”OVERALL RESPONSE
Section titled “OVERALL RESPONSE”Staff created a web-based survey available in seven different languages (English, Spanish, Chinese, Tagalog, Vietnamese, Russian, and Hindi). Survey participants answered questions related to environmental justice topics. Data was aggregated and utilized by staff in policy development and in determining community priorities. The survey was open to people residing or working in zip codes that include EJ Communities during October and November 2018. 719 individuals participated.
SURVEY AND RESPONSES
Section titled “SURVEY AND RESPONSES”Q1: WHERE DO YOU LIVE? PLEASE PLACE A CHECK MARK IN THE APPROPRIATE BOX.
Section titled “Q1: WHERE DO YOU LIVE? PLEASE PLACE A CHECK MARK IN THE APPROPRIATE BOX.”| ANSWER CHOICES | RESPONSE PERCENTAGE | TOTAL RESPONSE |
|---|---|---|
| West Arden-Arcade (Zip Codes: 95821, 95825, 95864) | 41.86% | 301 |
| North Highlands/Foothill Farms (Zip Codes: 95652, 95660, 95841, 95842) | 12.38% | 89 |
| South Sacramento (Zip Codes:95820,95823,95824,95828) | 12.24% | 88 |
| Vineyard (Zip Codes:95826,95827,95829,95830) | 11.68% | 84 |
| Other | 21.97% | 158 |
Total Respondents: 719
Q2: WHAT IS THE NEAREST CROSS STREET INTERSECTION TO WHERE YOU LIVE?
Section titled “Q2: WHAT IS THE NEAREST CROSS STREET INTERSECTION TO WHERE YOU LIVE?”Various
Q3: WHAT IS YOUR ANNUAL HOUSEHOLD INCOME?
Section titled “Q3: WHAT IS YOUR ANNUAL HOUSEHOLD INCOME?”| ANSWER CHOICES | RESPONSE PERCENTAGE | TOTAL RESPONSE |
|---|---|---|
| Less than $25,000 | 8.97% | 49 |
| $25,000 to $50,000 | 20.70% | 113 |
| $50,000 to $90,000 | 34.07% | 186 |
| $90,000 or more | 36.81% | 201 |
Total Respondents: 546
Q4: PUBLIC FACILITIES: CHOOSE THE THREE THINGS THAT ARE MOST NEEDED IN YOUR NEIGHBORHOOD. PLEASE RANK THEM FROM 1 TO 3 WITH 1 BEING THE MOST NEEDED.
Section titled “Q4: PUBLIC FACILITIES: CHOOSE THE THREE THINGS THAT ARE MOST NEEDED IN YOUR NEIGHBORHOOD. PLEASE RANK THEM FROM 1 TO 3 WITH 1 BEING THE MOST NEEDED.”| ANSWER CHOICES | RESPONSE PERCENTAGE | TOTAL RESPONSE |
|---|---|---|
| Senior Centers | 14.04% | 75 |
| Youth Centers | 12.17% | 65 |
| Child Care Centers | 2.62% | 14 |
| Parks | 7.87% | 42 |
| Public Swimming Pool | 5.06% | 27 |
| Health Care Facilities | 6.55% | 35 |
| Bicycle Lanes (On-Road) | 11.61% | 62 |
| Off-Road Bicycle and Walking Trails | 12.36% | 66 |
| Bus Service and Bus Stops | 7.68% | 41 |
| Homeless Shelters | 28.46% | 152 |
| Community Centers | 5.24% | 28 |
| Libraries | 3.75% | 20 |
| Street Improvements | 48.13% | 257 |
| Schools | 2.62% | 14 |
| Street Lights | 28.09% | 150 |
| Sidewalk Improvements | 28.09% | 150 |
| I do not think my neighborhood needs any of these things | 5.24% | 28 |
| Other (please specify) | 27.34% | 146 |
Total Respondents: 534
Q5: CRIME PREVENTION: CHOOSE UP TO THREE AREAS IN YOUR NEIGHBORHOOD WHERE YOU DO NOT FEEL SAFE.
Section titled “Q5: CRIME PREVENTION: CHOOSE UP TO THREE AREAS IN YOUR NEIGHBORHOOD WHERE YOU DO NOT FEEL SAFE.”| ANSWER CHOICES | RESPONSE PERCENTAGE | TOTAL RESPONSE |
|---|---|---|
| My Home | 8.33% | 44 |
| My Neighborhood | 30.30% | 160 |
| A Major Street (ie. Howe Avenue, Watt Avenue or Florin Road) | 38.07% | 201 |
| A Park | 22.54% | 119 |
| A Shopping Center | 22.92% | 121 |
| A ConvenienceStore | 22.16% | 117 |
| A Liquor Store | 13.45% | 71 |
| At an ATM | 17.80% | 94 |
| At an Apartment Building that is Not My Residence | 13.26% | 70 |
| I feel safe in my neighborhood | 22.35% | 118 |
| Other (please specify) | 16.86% | 89 |
Total Respondents: 528
Q6: HEALTHY FOOD ACCESS: CHOOSE UP TO THREE THINGS THAT PREVENT YOUR FAMILY FROM GETTING FRESH FRUITS AND VEGETABLES AND OTHER HEALTHY FOOD.
Section titled “Q6: HEALTHY FOOD ACCESS: CHOOSE UP TO THREE THINGS THAT PREVENT YOUR FAMILY FROM GETTING FRESH FRUITS AND VEGETABLES AND OTHER HEALTHY FOOD.”| ANSWER CHOICES | RESPONSE PERCENTAGE | TOTAL RESPONSE |
|---|---|---|
| Healthy food is too expensive | 21.71% | 114 |
| I do not have a job so I cannot pay for healthy food | 2.10% | 11 |
| I do not have a way to get to the store | 0.76% | 4 |
| Stores are toofar away | 9.71% | 51 |
| Lack of time available (cooking preparation) | 7.43% | 39 |
| Physical disabilities | 2.86% | 15 |
| I am too busy to cook | 5.33% | 28 |
| I have a disability | 2.86% | 15 |
| I do not have a kitchen | 0.19% | 1 |
| I am not sure how to cook fruits, vegetables and healthy meats | 3.43% | 18 |
| Fast food restaurants are nearby | 7.24% | 38 |
| I do not want to eat more healthy foods | 1.90% | 10 |
| I do not have any problems that keep me from getting fresh fruits and vegetables and other healthy food | 69.71% | 366 |
| Other (please specify) | 8.00% | 42 |
Total Respondents: 525
Q7: HOUSING: CHOOSE UP TO THREE HOUSING PROBLEMS THAT EXIST IN YOUR NEIGHBORHOOD.
Section titled “Q7: HOUSING: CHOOSE UP TO THREE HOUSING PROBLEMS THAT EXIST IN YOUR NEIGHBORHOOD.”| ANSWER CHOICES | RESPONSE PERCENTAGE | TOTAL RESPONSE |
|---|---|---|
| People trying to rent or buy a home are discriminated against because of race, age | 3.64% | 19 |
| There are not enough choices of places to live for people with disabilities | 5.56% | 29 |
| Utilities (heating, gas, etc.) are too expensive | 21.07% | 110 |
| Houses and apartments are not comfortable, not safe, in poor condition, or too dangerous | 17.82% | 93 |
| Too many people live together in one home because it is too expensive to rent or buy your own | 25.86% | 135 |
| People are being forced out of their homes because it is too expensive | 20.69% | 108 |
| Renters do not have enough money for things like food and clothes after paying expensive rents | 23.37% | 122 |
| People who want to buy homes just cannot because it’s too expensive | 37.36% | 195 |
| I do not think there are any housing problems in my neighborhood | 21.84% | 114 |
| Other (please specify) | 19.73% | 103 |
Total Respondents: 522
Q8: PHYSICAL EXERCISE: CHOOSE UP TO THREE THINGS THAT KEEP YOU FROM WALKING OR BICYCLING AS MUCH AS YOU WOULD LIKE.
Section titled “Q8: PHYSICAL EXERCISE: CHOOSE UP TO THREE THINGS THAT KEEP YOU FROM WALKING OR BICYCLING AS MUCH AS YOU WOULD LIKE.”| ANSWER CHOICES | RESPONSE PERCENTAGE | TOTAL RESPONSE |
|---|---|---|
| Too few bikelanes | 15.50% | 80 |
| Bike lanes or travel lanes on many streets are scary to use because of the high number and high speed of cars and trucks | 41.86% | 216 |
| Bike facilities start and stop at random. Are not predictable or continuous | 14.53% | 75 |
| Too few sidewalks or sidewalks are too narrow | 28.88% | 149 |
| It’s too hot and there are too few trees for shade | 11.63% | 09 |
| Not enough places to go (grocery store, school, place to work), or they are too far away to walk or bicycle to | 11.82% | 61 |
| I do not have a bike, or there are no places to get my bike fixed | 5.04% | 26 |
| Not enough adequate bicycle parking in my community | 4.84% | 25 |
| I don’t feel safe from crime when I bike or walk | 38.76% | 200 |
| I have to rely on my car to make multiple trips a day | 15.31% | 79 |
| I don’t want to walk more or bicycle more | 8.72% | 45 |
| Other (please specify) | 20.35% | 105 |
Total Respondents: 516
Q9: POLLUTION: CHOOSE UP TO THREE POLLUTION PROBLEMS IN YOUR NEIGHBORHOOD.
Section titled “Q9: POLLUTION: CHOOSE UP TO THREE POLLUTION PROBLEMS IN YOUR NEIGHBORHOOD.”| ANSWER CHOICES | RESPONSE PERCENTAGE | TOTAL RESPONSE |
|---|---|---|
| Bad air pollution from cars and trucks | 29.46% | 152 |
| Bad drinking water | 13.57% | 70 |
| Vacant lots with trash or junk | 50.97% | 263 |
| Trash in streams and rivers | 22.29% | 115 |
| People dump dangerous chemicals | 6.78% | 35 |
| My well water is not safe to drink | 0.78% | 4 |
| Noisy cars and trucks | 35.47% | 183 |
| Noisy airplanes | 12.02% | 62 |
| Dangerous fumes from businesses, like auto paint shops and car repair shops | 3.49% | 18 |
| Graffiti | 14.15% | 73 |
| I do not think there are any pollution problems in my neighborhood | 12.79% | 66 |
| Other (please specify) | 19.77% | 102 |
Total Respondents: 516
Q10: CIVIC ENGAGEMENT: CHOOSE UP TO THREE THINGS THAT PREVENT YOU FROM ATTENDING AN EVENING PUBLIC MEETING TO TALK ABOUT THE THINGS THAT COULD MAKE LIFE BETTER OR WORSE IN YOUR NEIGHBORHOOD.
Section titled “Q10: CIVIC ENGAGEMENT: CHOOSE UP TO THREE THINGS THAT PREVENT YOU FROM ATTENDING AN EVENING PUBLIC MEETING TO TALK ABOUT THE THINGS THAT COULD MAKE LIFE BETTER OR WORSE IN YOUR NEIGHBORHOOD.”| ANSWER CHOICES | RESPONSE PERCENTAGE | TOTAL RESPONSE |
|---|---|---|
| I cannot understand English | 0.39% | 2 |
| I do not have enough time - too busy | 26.32% | 135 |
| Ineed child care | 5.85% | 30 |
| I do not trust the government | 9.16% | 47 |
| I do not think they will take my opinions seriously | 43.08% | 221 |
| I am too tired to go to a meeting after work | 16.96% | 87 |
| I think it will be a waste of time | 32.94% | 169 |
| It would be too hard to get to the meeting | 5.65% | 29 |
| No food and/or drinks (water, juice, snacks) at meetings | 2.34% | 12 |
| I work evenings or nights | 6.24% | 32 |
| Other (please specify) | 36.84% | 189 |
Total Respondents: 513
APPENDIX A-3: COMMUNITY WORKSHOPS
Section titled “APPENDIX A-3: COMMUNITY WORKSHOPS”WEST ARDEN-ARCADE COMMUNITY WORKSHOP (OCTOBER 16, 2018)
Section titled “WEST ARDEN-ARCADE COMMUNITY WORKSHOP (OCTOBER 16, 2018)”COMMUNITY STRENGTHS
Section titled “COMMUNITY STRENGTHS”- Parks (6 votes)
- Businesses (4 votes)
- Diversity (8 votes)
- Welcoming (2 votes)
- Housing Diversity (6 votes)
- Connectivity (1 vote)
- Retail Options
- Specialty Stores (4 votes)
- Sense of Community (1 vote)
CIVIL ENGAGEMENT/PUBLIC FACILITIES
Section titled “CIVIL ENGAGEMENT/PUBLIC FACILITIES”Note: Problems and solutions were split between E1 (Civil Engagement) and E2 (Public Facilities)
Challenge E1 (suggested by PER staff): Few neighborhoods represented by a neighborhood association (West of Watt Ave).
Challenge E1: Having more representative populations involved. (1 vote)
Challenge E1: Lack of regular/ongoing community engagement and services.
Challenge E1: People only engage when they’re complaining (1 vote).
Challenge E1: Lack of door-to-door community engagement.
Challenge E1: There are not enough services that are provided during engagement. And specifically services that are relevant to the community.
- Solution E1 (suggested by PER staff): Encourage neighborhoods to establish neighborhood associations.
- Solution E1 (suggested by PER staff): County will create a comprehensive Community Outreach Strategy.
- Solution E1: Gathering Hub that keeps a space for difference organizations/groups/community members to work together and leverage relationships; for funding opportunities. (3 votes)
- Solution E1: Continuous gatherings. Ongoing groups.
- Solution E1: Active transportation funding. Cap and Trade funding. (1 vote)
- Solution E1: Churches/nonprofits.
- Solution E1: More community clean up days.
- Solution E1: More neighbor support days. Seniors/disabilities/homeless.
- Solution E1: Development of community culture & responsibility & ownership. (4 votes)
- Solution E1: Develop more proactive positive outreach. More opportunities to participate before problems arise.
- Solution E1: Make it fun. (1 vote)
- Solution E1: Having planners spend more time in the communities.
- Solution E1: Improve 311 and provide 311 education (introduction to app).
- Solution E1: Partner with existing County services to leverage resources for outreach. (1 vote)
- Solution E1: Ask the communities what the solutions look like.
Challenge E2: School board, Parks and Rec, Community Groups - difficulty connecting and coordinating; missed opportunity; more interagency collaboration.
Challenge E2: Loss of access to some parks.
Challenge E2: No access to public restrooms. (2 votes)
- Solution E2: Partner with waste management on illegal dumping (funding opportunity). (1 vote)
- Provide community service to encourage community engagement.
SAFE AND SANITARY HOUSING
Section titled “SAFE AND SANITARY HOUSING”Challenge C1 (suggested by PER staff): High rate of housing cost burdened households (spend more than 30% of income toward housing expenses). (1 vote)
Solution C1 (suggested by PER staff): Consider making changes to County Affordable Housing Program (5 votes).
Challenge C2: lack of housing (affordable, rental and owner). (8 votes)
Solution C2: incentives for housing (fees, funding). (4 votes)
Challenge C3: Cost of rentals.
Solution C3: Rent control. (2 votes)
Challenge C4: Poor ‘bad’ conditions of apartments and rentals. (3 votes)
Solution C4: Code enforcement (housing conditions, fair housing). (2 votes)
Challenge C5: Homelessness increasing. (3 votes)
Solution C5: Infill development incentives (without gentrification). (7 votes)
Challenge C6: Evictions.
Solution C6: Partner with outside entities to target neighborhoods (trees, house repair, clean up) like NeighborWorks, Habitat for Humanity etc.
Challenge C7: Emergency housing.
Solution C7: Weatherization programs and partnerships (SMUD and CRP) advertising, education, and collaboration.
Challenge C8: Lack of diversity within neighborhoods.
Solution C8: Place affordable housing in better, more expensive neighborhoods to create mixed income neighborhoods. (1 vote)
Challenge C9: Lack of amenities correlates to housing issues (infrastructure connectivity). (2 votes)
Solution C9: Database to collect health data to see neighborhoods ‘hot spots’ and partner for solutions.
Challenge C10: Placing housing in areas with higher air pollutants.
Solution C10: More education and partners regarding fair housing (Renters Helpline).
Challenge C11: Safety issues with older homes (lead, asbestos, mold). (1 vote)
Challenge C12: Landlords won’t take Section 8 vouchers.
Challenge C13: Overcrowding.
HEALTHY FOOD ACCESS
Section titled “HEALTHY FOOD ACCESS”Note: Problems and solutions beyond B2 were not numbered or organized together.
Challenge B1 (suggested by PER staff): West of Watt Ave. - Highest food insecurity rates (limited ability to get nutritious foods) in the County.
Solution B1 (suggested by PER staff): Develop a Countywide Food Action Plan support equitable and healthy food system.
Solution B1 (suggested by PER staff): Require new convenience stores to have 15% of shelf space reserved for healthy foods.
Challenge B2: Expense of healthy foods
Solution B2: Increase EBT access at stores.
Challenge:
- Food desert - no grocery stores. (5 votes)
- Lots of need for food distribution with food bank.
- SB 1383 implementation (food waste redirection).
- Lack of accountability for policies passed. (2 votes)
- Economic Development.
Solutions:
- Engaging with schools to improve attitudes about healthy foods.
- Community based organizations interacting with youth about farms and gardens and foods. (1 vote)
- Incentivize farmers markets. (1 vote)
- Partnerships between County and schools for farmers markets.
- Along Marconi, to railroad trucks lack of food access/grocery.
- Low-income neighborhood, no access
- Indicated by River City Food Bank distributions ~900 people at Saint Matthews Episcopal Church
- Incentivize new grocery stores - not convenience stores. (1 vote)
- Issues with land cost, curbs, gutters, cost is huge
- Tax credits for urban AG in County need to pass. (1 vote)
- Large empty lots that can be used
- Collaboration between parks/empty lots for gardens - tax credit to land owners.
- Resources and investment need to be specifically directed to EJ neighborhoods.
- o Bring grocery stores
- Improved transit access. (2 votes)
- Increase farmers markets and Market Match.
- Access to culturally appropriate food that accepts EBT.
- New/immediate funding sources.
POLLUTION EXPOSURE
Section titled “POLLUTION EXPOSURE”Challenge D1 (suggested by PER staff): Higher rates of emergency visits for asthma. (2 votes)
Challenge D2 (suggested by PER staff): High rates of ozone (Entire Sacramento County).
Challenge D3 (suggested by PER staff): Higher rates of diesel particulate matter. (1 vote)
Solution D1, D2, D3 (suggested by PER staff): Require use permit for childcare centers. (2 votes)
Solution D1, D2, D3: Require indoor filtration for existing childcare centers.
Solution D1, D2, D3: Require use permit for congregate care facilities.
Solution D1, D2, D3: Invest in nonpolluting transportation alternatives (car share, transit, bicycle and pedestrian infrastructure). (5 votes)
Solution: Vegetative barriers. More pollutant absorbing trees. (1 vote)
Solution D1, D2, D3: Landscape strips between street and sidewalk.
Solution D1, D2, D3: Road diets to slow down traffic (would encourage active transportation). (1 vote)
Solution D1, D2, D3: Pedestrian bridges across arterials.
PHYSICAL ACTIVITY
Section titled “PHYSICAL ACTIVITY”Note: Problems and solutions beyond A5 were not numbered or organized together.
Challenge A1 (suggested by PER staff): Higher obesity rates. (1 vote)
Challenge A2 (suggested by PER staff): Shortage of bike lanes (on street and off street). (3 votes)
Challenge A3 (suggested by PER staff): High rate of bike and pedestrian collisions (with cars).
Solution A1, A2, A3 (suggested by PER staff): Prioritize ‘Complete Streets’ projects for EJ Communities. Remodel streets for transit, pedestrian, and bicycle use as well as vehicles. (7 votes)
Solution A1, A2, A3 (suggested by PER staff): Low stress bicycle lanes. Faster and heavier the traffic, the more protection for bicyclists.
Solution A1: address speed. (1 vote)
Solution A2: more general fund more for transportation.
Solution A3: more separation from cars for bikes. (1 vote)
Challenge A4: Inattentive drivers.
Solution A4: Vision Zero.
Challenge A5: Unsheltered bus stations. (2 votes)
Solution A5: Cap and trade strategy.
Challenge: Lack of focus on prioritizing money to EJ communities for sidewalks, bike facilities. (5 votes)
- Funding not based on community needs
Challenge: Corner of Edison and Bell: Densely populated with low income people.
Solution: Possible criteria: school routes.
Challenge: Can’t implement new Design Guidelines in existing neighborhoods.
Challenge: Nonexistent bike facilities.
Challenge: Roads are crowded and have obstacles. (1 vote)
Solution: Wider sidewalks. (2 votes)
Solution: Separation of bike lanes. (1 vote)
CRIME PREVENTION
Section titled “CRIME PREVENTION”Note: Solutions beyond F2 were not numbered or organized together to associate with a problem.
Challenge F1 (suggested by PER staff): Three violent crime ‘hot spots’.
Challenge F2 (suggested by PER staff): High density of businesses with liquor licenses. (1 vote)
Solution F1, F2 (suggested by PER staff): Require permits for off-sale liquor licenses (will also require existing businesses to get permits). Place limits on single serving containers. (7 votes)
Challenge F3: Fast food restaurants and associated crime. (1 vote)
Challenge F4: Smoking near buildings. (tobacco, marijuana)
Challenge F5: Property crime. (2 votes)
Solution: Safe streets.
Solution: Transportation plan.
Solution: Defined criteria for PCN.
Solution: Community police alternatives.
SOUTH SACRAMENTO COMMUNITY WORKSHOP (OCTOBER 25, 2018)
Section titled “SOUTH SACRAMENTO COMMUNITY WORKSHOP (OCTOBER 25, 2018)”COMMUNITY STRENGTHS
Section titled “COMMUNITY STRENGTHS”- Variety of food
- Public transportation
- Cultural diversity
- Local businesses
- Sam Pannell Pool
- After school programs
- Youth sports
- Generational living
CRIME PREVENTION
Section titled “CRIME PREVENTION”Challenge 1 (Suggested by PER staff): two violent crime ‘hot spots’. (1 vote)
Solutions:
-
Solution: lighting improvements and street beautification. (1 vote)
-
Solution: Promise Zone and Opportunity Zone.
-
Solution: Improved transit.
-
Solution: CPTED Audit/Change of ownership to trigger CPTED evaluation.
-
Solution: Sherriff communication with businesses.
-
Solution: Problem Oriented Policing.
Challenge2 (Suggested by PER staff): high density of businesses with liquor licenses
- Solution: (Suggested by PER staff) require use permits for off-sale liquor licenses (will also require existing businesses to get permits). Place limits on single serving containers.
- Solution: Reach out to liquor store owners.
- Solution: Concentration restriction of new applications. (1 vote)
- Solution: Infrastructure improvements for local businesses - incentives?
- Solution: Youth sports group/advocates engagement.
- Solution: After-school programs for middle/high school youth.
- Solution: Create network forum/news sharing among youth groups, advocates, and non-profits.
- Solution: Connecting youth groups with political representatives/elected officials. (1 vote)
- Solution: Partner with Parks and Recreation Departments and school districts to build community facilities and improve access to sports/community facilities for youth groups/residents. (1 vote)
Challenge 3: Florin is a commercial center where residents make and spend their money - congregation of prostitution, gang, and domestic violence.
Challenge 4: The right question is: What is causing the need for liquor consumption?
- Solution: Radius requirements/restrictions from schools, parks, churches.
- Solution: Communication/relationship between Sherriff/law enforcement and liquor storeowners.
- Solution: Support local businesses: training, incentives, communication, and engagement.
- Solution: Job training: business leaders/committees/neighborhood associations’ initiative to hire/train/educate youth and residents. (3 votes)
- Solution: Reach out to education leaders and business leaders/associations. (1 vote)
- Solution: Partnerships with community.
- Solution: Liquor stores are only a contributing factor and not a root cause of crime - presumption of cause-effect relationship.
- Solution: Economic analysis at the neighborhood level.
- Solution: Bring data to communities.
Problem 5: School district fees for using facilities are too high to be accessible to youth groups.
PHYSICAL ACTIVITY
Section titled “PHYSICAL ACTIVITY”Challenge 1 (Suggested by PER staff): Highest obesity rates in the County.
Challenge 3: Truck routes as a barrier.
Challenge 4: Stockton Boulevard.
Challenge 5: Florin.
Challenge 6: Lighting at parks.
Challenge 7: Speed of traffic.
Challenge 8: Utility poles in sidewalk.
- Solution: Striping.
- Solution: Slow speeds.
- Solution: Consider road diets.
- Solution: JUMP bikes - but only when comfortable using streets.
- Solution: Prioritize bike/ped access to light rail.
Challenge 2 (Suggested by PER staff): High rate of bike and pedestrian collisions (with cars).
- Solution (Suggested by PER staff): prioritize ‘Complete streets’ projects for EJ Communities. Remodel streets for transit, pedestrians, and bicycle use as well as vehicles. (4 votes)
- Solution (Suggested by PER staff): low stress bicycle lanes. Faster and heavier the traffic, the more protection for bicyclists.
- Solution: Vision Zero (2 votes).
Challenge 3: ‘Complete’ Streets are not really a complete street. Still unsafe, poor transit facilities.
- Solution: Create continuous bike facilities and sidewalks. (2 votes)
- Solution: More distance between bikes/cars ‘separated bike lanes’.
- Solution: Get more use out of parks by making them more accessible. Improve access.
- Solution: Prioritize physical access to key destinations (eg - healthy food).
- Solution: Solar paneled lights.
- Solution: Safe routes to school. (2 votes)
- Solution: Improve shade. (1 vote)
Challenge 4: Destinations are too spread out.
- Solution: more mixed uses, density. (3 votes).
- Solution: Challenge to use bikes and light rail. Improve access at stations.
POLLUTION EXPOSURE
Section titled “POLLUTION EXPOSURE”Challenge 1 (Suggested by PER staff): Highest rates of emergency visits for asthma. (6 votes)
- Solution: subsidy/grant for low-income sensitive receptors for filters (MERV 13 HVAC and room HEPA filters).
Challenge 2 (Suggested by PER staff): Highest rates of diesel particulate matter.
- Solution (Suggested by PER staff): Require use permits for childcare centers when within 500 feet of a high traffic volume roadway. (3 votes)
- Solution (Suggested by PER staff): discourage residential neighborhoods being adjacent to industrial areas.
Challenge 3: Allergic reactions to trees used along barrier walls.
- Solution: Require the use of low VOC vegetative barriers. (1 vote)
Challenge 4: Construction projects emitting dust.
- Solution: Require conditions of approval on construction projects to provide neighbors with filters. (2 votes)
- Solution: Public education about SMAQMD’s role. Door fliers.
Challenge 5: Illegal dumping/storm water run-off. (3 votes)
- Solution: More drop-off days with monitors for hazardous materials and education. (2 votes)
- Solution: Require bio swales in new developments.
Challenge 6: Pet waste at parks.
Challenge 7: Noise pollution from Executive Airport (increased within last 2 years).
- Solution: Sacramento County Airports should conduct public engagement in South Sacramento.
SAFE AND SANITARY HOMES
Section titled “SAFE AND SANITARY HOMES”Challenge 1 (Suggested by PER staff): High rate of housing cost burdened households (spend more than 30% of income toward housing expenses).
- Solution (Suggested by PER staff): Review the Affordable Housing Program for potential changes that could assist in producing more affordable housing.
- Solution: County fee waivers for affordable housing.
- Solution: County/school district owned land for affordable housing.
-
- Solution: TOD/Car sharing. (1 vote)
- Solution: Inclusionary housing. (10 votes)
- Solution: Refurbish hospitals, other building for affordable housing.
- Solution: Address zoning issues. (1 vote)
- Solution: New local revenue source for match.
- Solution: Rent control. (8 votes)
- Solution: Code amendments for housing. (3 votes)
Challenge 2 (Suggested by PER staff): Unhealthy, not safe housing.
-
Solution: Proactive Rental Housing Inspection on all rental properties. (1 vote)
-
Solution: Code enforcement. (3 votes)
-
Solution: Limited A.A. Housing options.
-
Solution: Legal counsel by right (fund).
-
Solution: Develop transitional housing. (2 votes)
-
Solution: Education/solutions for lead and asbestos abatement. (1 vote)
Challenge 3(Suggested by PER staff): Overcrowding in housing.
- Solution: Accessory dwelling use.
- Solution: Prioritize large family for Affordable Housing.
- Solution: Sewer credits.
- Solution: Prevent gentrification.
- Solution: Sacto land trust.
Challenge 4 (Suggested by PER staff): Lack of accessible housing.
Challenge 5 (Suggested by PER staff): Resident support services lacking for transitioning to rental/ownership.
HEALTHY FOOD ACCESS
Section titled “HEALTHY FOOD ACCESS”Challenge 1 (Suggested by PER staff): High food insecurity rates (limited ability to get nutritious foods) in the County.
-
Solution (Suggested by PER staff): Develop a Countywide Food Action Plan support equitable and healthy food systems.
-
Solution (Suggested by PER staff): Require new convenience stores to have at least 15% of shelf space reserved for healthy foods.
-
Note: What is the definition of healthy food?
-
Note: Who will pay for FAP?
-
Note: What incentivizes grocery stores?
-
Solution: We need Trader Joes/Sprouts organic healthy foods here. (1 vote)
-
Challenge: You have to leave here to find food.
-
Challenge: Spending money on housing- less money for food.
-
Solution: Map of food banks/pantry locations.
-
Solution: Bring in grocery stores with EIR and mitigation measures.
-
Solution: Edible landscaping (aware of issues with sanitation). (1 vote)
-
Solution: Community gardens.
-
Solution: Quick funding options for incentives & stores.
-
Solution: Website with comprehensive info on healthy food access. (1 vote)
-
Solution: Work with EMD on allowing more small food vendors.
-
Solution: Grow food in your backyard. (1 vote)
-
Solution: Educate/clarify on Urban Agriculture Ordinance
-
Solution: Incentivize home gardens.
-
Solution: farmers markets and Market Match needed.
-
Solution: Access food within 5 minutes (transit, bikeable, walkable). (1 vote)
-
Solution: SB 1383 food waste projects (recovery and donation) donate compost to communities.
-
Solution: Connect retail space with EMD inspections.
CIVIL ENGAGEMENT
Section titled “CIVIL ENGAGEMENT”Challenge:
- Lack of coordination between City/County.
- County doesn’t work well with community orgs. Building capacity with existing orgs. (1 vote)
- Keeping in mind the appropriate cultural messaging when doing outreach.
- Lack of representation for identified community outreach. Information is disseminated in many different ways/languages.
- Inside/outside building. Bringing in community partners/agencies.
- Keep the engagement ongoing and as a part of the actual community.
- More creative methods of outreach to start building trust.
- The community doesn’t trust government.
- We need neighborhood scaled plans and not regional level. Build from within not from without.
- Putting the onus of the issues on the community instead of the agency.
- Be intentional with the messaging.
- Childcare.
- Language assistance.
- What is the incentive for the community to participate?
- Articulate the process. Tell us what is happening and when.
- Youth engagement. Introducing youth to civic participation.
- Age/culture/special interest silos: bringing all agencies into the fold.
- Offer transportation. Remove barriers to access.
- Learn the demographics of the community you are reaching out to.
Solutions:
-
Good faith actions speak louder than words.
- Enabling staff/planners to interact with people in their day-to-day lives.
- The people that most need outreach will not come to meetings.
-
Improving CPAC meetings.
-
Advertising messaging.
- Break down to specific issues rather than Environmental Justice.
-
Breaking down to specific projects in order to make EJ more tangible.
- i.e. ‘Complete streets program’.
- Home retrofit projects, Live Well Initiative.
-
Youth Engagement.
- Getting youth involved with research/development/policy.
-
Utilizing existing community based orgs community relationships as avenue for engagement. (2 votes)
- ‘3 degrees of separation’.
-
Specific projects with specific opportunities for community leadership and ownership.
- Community member air quality data collection.
-
Educational programs focusing on accessing resources - i.e. 311.
-
Civic engagement and Leadership capacity building programs. (4 votes)
- Boards and commission leadership institution.
- High school government classes.
- Improving representation on youth commissions.
-
Ensuring that communication loop is closed.
- i.e. follow up from community meeting.
- Transparency and accountability.
- Building ‘community institutions’.
- People not feeling ‘used’.
-
Finding ways to support new/existing neighborhood associations - prioritizing EJ communities.
- i.e. neighborhood leader ‘planning retreat’.
- Identifying neighborhood ‘champions’ (organizations) to connect residents to policy processes.
NORTH HIGHLANDS/FOOTHILL FARMS COMMUNITY WORKSHOP (JANUARY 22, 2019)
Section titled “NORTH HIGHLANDS/FOOTHILL FARMS COMMUNITY WORKSHOP (JANUARY 22, 2019)”COMMUNITY STRENGTHS
Section titled “COMMUNITY STRENGTHS”-
WOW Produce - access to healthy food in the food desert that is North Highlands.
-
History - sense of community.
-
Diversity.
-
Black Child Legacy Campaign.
-
North Highlands parks.
-
Educational opportunities.
- 2 high schools.
- American River College satellite campus.
-
DHS office.
-
Freedom Park.
-
Construction Businesses.
-
Air Force Base.
-
Open track (near meeting place).
-
Faith communities.
-
Non-profits.
-
Community hope - did not exist before (after the base closure).
-
Bus routes.
CIVIL ENGAGEMENT
Section titled “CIVIL ENGAGEMENT”-
Better engagement. (2 votes)
-
Increased social media presence.
-
Centralized community information/updates.
-
Placemaking - community centers - other. (1 vote)
-
Opportunities for folks to gather - town square. (2 votes)
-
Beautification. (1 vote)
-
Identify areas that could be ready for activation.
-
Public pools, libraries, parks, etc. Bring back.
-
Identify the priorities of our youth to engage or be engaged. Additional resources/activities.
-
Pop-ups to activate historic spaces.
-
Community pride through activations.
- Concert in the park.
- Farmers market. (1 vote)
-
Making community meetings more accessible.
- Culturally appropriate.
- Easier access - transportation.
- Face to face meetings - relationship building.
- Using schools as community brokers.
- Easy dialog: de-wonk the conversation and social media.
- Go where the people are.
-
Social media - post the meetings.
-
Engaging and partnering with local CBOs, non-profits, local churches and business improvement districts. (1 vote)
-
Flyers and materials: PDF, flyers, etc. to share updates and upcoming events or meetings.
-
Public meetings.
- Reduce jargon/use common terms.
-
Public meeting spaces for businesses to use.
-
Neighbor associations and watch groups.
-
Build better relationships with community members.
-
Childcare for public meetings.
PUBLIC FACILITIES
Section titled “PUBLIC FACILITIES”- Healthcare/mental care facilities. (2 votes)
- Birthing centers/prenatal care.
- Health and Human Services in neighborhoods.
- Cleaner parks.
- Community gardens.
- Clean up vacant lands.
- More community hubs/nodes (i.e. gardens, etc.).
- School connections/places for kids to go.
- More employment.
- Indoor sports facility.
- All night safe space/recreation center for youth.
- Boys and Girls Club.
- Crises nursery (First5 Program).
- Small business incubator.
- Resume building.
- Urban League.
PHYSICAL ACTIVITY
Section titled “PHYSICAL ACTIVITY”- Access to parks (Freedom Park, etc.).
- Promoting community programs. (2 votes. 1 vote - non-NH)
- Railroad and freeway can create barriers.
- Smart ride.
- Park facilities could be more relevant to needs of users. (1 vote)
- Make pools more accessible, Foothill High School.
- Study these, publicize.
- High speed, high capacity roads are barriers.
- Trees are in parks but not necessarily elsewhere. (1 vote - non-NH)
- Equip folks with tools to be active.
- Bicycling on roads is not safe.
- Do have trails.
- Lighting.
- Can we access destinations from Dry Creek Trail. (1 vote - non-NH)
- Leash laws - enforce.
- Car centric design is a barrier to physical activity.
- Need bike lanes.
-
More separation from cars.
-
Prioritized raised, separated bike facilities. (1 vote)
-
- Prioritize physical (walk/bike access) to transit.
- Tree canopy.
- Become County of trees.
- Activation.
- Pop-up parks - activate underutilized areas/land.
- Support CBOs having events/activity spaces throughout the community.
- Change the perception of people who walk/bike.
- Programs to encourage, celebrate.
- Prioritize RT access to parks/centers.
- Neighborhood circulation shuttle.
- Neighborhood beautification.
- Roseville Road - lack of lighting, dumping etc.
- Access to gardens. (6 votes)
- Community co-op farming.
- Need sidewalks now. Don’t wait for development.
- Lighting. (1 vote)
- Bathrooms at parks.
- Need more trails and bike paths along arterials.
- Address physical and personal safety.
- Support gardens and multigenerational parks.
- Educational workshops on personal gardens.
- Bike parking standards.
- Adopt the city’s.
POLLUTION EXPOSURE
Section titled “POLLUTION EXPOSURE”-
Group 1
- Concerns:
-
Congestion on Elkhorn
-
Trains
-
Trash in waterways
-
Water quality - polluted runoff
-
Homeless - trash dumping
-
Illegal dumping - Roseville Road
-
Deficient landscaping
-
Toxic soil (nuclear waste) at McClellan Base
-
Solutions
- More County-installed trees.
- Enforce landscape requirements.
- Community place making.
-
Walkable communities (1 vote)
-
Mixed-use
-
Neighborhood destinations (such as market)
- More green space.
- Traffic light optimization.
- Community car share - all electric.
- Improved pedestrian bike paths.
-
Group 2
- Concerns
-
Polluted waterways
-
Watt Avenue traffic/congestion
-
Illegal dumping (1 vote)
-
Wild fire smoke
- Solutions
-
Education - oil dumping
-
Portable air filter (room size)
-
HOV lane on Watt Avenue
-
Fasttrak
-
More public transportation
-
Connect Card (Transit Card)
-
Universal transit card
-
Coordinated transfers
-
Group 3
- Concerns
-
Auto pollution/train
-
Construction business equipment
-
Water pollution - drinking water quality
-
Need more trees (1 vote)
-
Trash dumping from homeless
- Solutions
-
Hyperloop/Light Rail to Roseville
-
EV charging stations
-
Enforce landscaping zoning standards
CRIME REDUCTION
Section titled “CRIME REDUCTION”- Lack of mental health care - require with new development. (2 votes)
- Increase in shelter services - require with new development. (2 votes)
- Sex trafficking awareness. (3 votes)
- Educational services
- Illegal dumping, outdoor drug use.
- CPTED design
- Vape shops.
- Zoning
- Homelessness, Porch Pirates, Home Invasion.
- Neighborhood Watch/Awareness (4 votes)
- Prostitution.
- Homeless.
- Improved street lighting.
- Neighborhood /Business Watch. (2 votes)
SAFE AND SANITARY HOMES
Section titled “SAFE AND SANITARY HOMES”- Homeless problem/drugs.
- Promote mental health services, provide information for homeless at Mercy Housing (4 votes)
- Mold. (1 vote)
- Bad Tenants. (1 vote)
- Neighborhood Watch
- Abandoned Homes - too many empty homes. (1 vote)
- Neighborhood Watch
- Urban homesteading (1 vote)
- Limit bank’s time to hold onto homes. Have County DA go after banks that hold homes for too long. (1 vote non-NH)
- Dark streets in residential areas - no lights. (1 vote non-NH)
- Hot homes during summer - threat to seniors. (2 votes)
- Monitors to check on people
- Apartments - more than one family - a problem. House - not a problem.
- Community policing.
HEALTHY FOOD ACCESS
Section titled “HEALTHY FOOD ACCESS”- Community garden efforts in North Highlands/Foothill Farms.
- Overgrow Sacramento
- North Highlands Community Garden
- Issue: Lack of funding and education.
- Solution: Better publicity for urban agriculture ordinance.
- Issue: Difficult to find space to sell food products (for small farmers).
- Issue: Safeway is expensive and WinCo is far away.
- Issue: Food served at schools is unhealthy. (1 vote)
- Solution: Turn vacant lots into gardens. (2 votes, 1 vote non-NH)
- Issue: Difficult to gain access to lots for community garden use.
- Issue: lack of security for gardens. Expensive to install fence and exterior restroom. (1 vote)
- Solution: Grant funds from healthy food funds. (1 vote)
- Solution: Farmers markets in underutilized parking lots. (2 votes - non-NH).
- Solution: WIC participant cooking classes.
- Solution: Grant-writing classes for urban farmers. (1 vote)
- Issue: Poor health related to food.
- Solution: Nutrition classes/support food programs for pregnant women/young families. (2 votes)
- Solution: Navigators for seniors or people with disabilities.
- Issue: Lack of awareness of existing food programs. (1 vote)
- Issue: Carcinogens in food.
- Issue: Lack of safe sidewalks/bike lanes to stores.
- Issue: Busses do not run frequently enough and they do not connect well. (1 vote non-NH)
- Issue: The last mile between the bus stop and your destination.
- Issue: Food deserts.
- Solution: Fruit/veggie truck instead of ice cream trucks.
- Solution: Use fruit trees as landscaping along streets or in subdivisions. (1 vote)
- Issue: Food waste/overproduction. (1 vote)
- Solution: Connect donors to churches/food banks.
APPENDIX A-4: HUB ORGANIZATION MEETINGS COMMENTS
Section titled “APPENDIX A-4: HUB ORGANIZATION MEETINGS COMMENTS”SACRAMENTO AREA CONGREGATIONS TOGETHER (SACRAMENTO ACT) WORKSHOP (NOVEMBER 12, 2018) -FOCUS ON WEST ARDENARCADE
Section titled “SACRAMENTO AREA CONGREGATIONS TOGETHER (SACRAMENTO ACT) WORKSHOP (NOVEMBER 12, 2018) -FOCUS ON WEST ARDENARCADE”HOUSING
Section titled “HOUSING”- Slumlords are a problem.
- Apartments in shambles.
- Not putting money into apartments/housing.
- Always looking for reasons to evict.
- Homeless - Homeless Vets.
- Need secure and clean homes.
- We need several Loaves and Fishes in Arden-Arcade.
- Problems in Accessibility.
- No elevators in Butano Apartments (three-story high apartments).
- Multi-flight stairs for those who have physical limitations.
- Huge disparity in income levels within short distances of each other.
- Resources for homeless.
- Need resources to help them find housing.
- Get resources to people in need.
- Need navigators for Arden-Arcade (note: navigators are used in South Sacramento and in the City to help people get the resources, they need.) Someone who can walk the homeless through the program.
- Existing homeless programs.
- Have requirements (obstacles).
- Arden-Arcade - one of the most affordable areas that are left. Many vulnerable people on fixed incomes.
- Obstacles to getting housing finance.
- Credit checks.
- Down Payment.
- Assisting the Homeless.
- County - once in a lifetime thing.
- Buffalo, NY - pay people to provide shelters.
- There are many vacant large buildings in Arden-Arcade - have homeless fix these buildings to make them habitable - create sense of ownership.
- Existing program - Winter Sanctuary.
- Bus homeless in to local churches; bus them out in the morning.
- Need more churches to participate.
- This is a band-aid only.
- ‘If I am a victim of my landlord, I do not know who to call’.
- Rental Helpline - operated by Sacramento Self-Help Housing.
- Mather and McClellan are big enough for another Loaves and Fishes.
- There are limited vacant lots in Arden-Arcade.
CIVIL ENGAGEMENT
Section titled “CIVIL ENGAGEMENT”- This requires dedicating time - volunteering - give some of your time.
- Board of Supervisors.
- Cannot depend on them.
- We need to talk among ourselves.
- Techniques.
- Find out who the chiefs are. The chiefs will bring the people.
- Reach people where they are. Example: set up a booth outside of Safeway.
- Other communities have united under a single issue.
- Use billboards (or message boards).
- Use technology - geotagging.
- Groups to contact.
- Find who the community groups are.
- Contact the churches.
- Developing trust relationships.
- Until they know that you care, they will not let you know what their concerns are.
- It is about being consistent - requires some nurturing and tilling.
- People are not as rooted here like in other areas (such as Del Paso Heights). Many college students.
- We need events to help people engage with each other.
- Identity - what is the identity of this community?
- Embrace the history of Arden-Arcade.
STEPHENS FOUNDATION WORKSHOP (DECEMBER 19, 2018) -FOCUS ON SOUTH SACRAMENTO
Section titled “STEPHENS FOUNDATION WORKSHOP (DECEMBER 19, 2018) -FOCUS ON SOUTH SACRAMENTO”POTENTIAL SOLUTIONS TO IDENTIFIED ISSUES
Section titled “POTENTIAL SOLUTIONS TO IDENTIFIED ISSUES”-
Charging stations for cell phones at light rail to increase public safety.
-
Home ownership assistance programs and incentives.
- To increase community pride.
- Reduce home destruction, crime.
- Inform public of high-risk loans.
- Promote civic engagement (more invested in community).
-
Access to public facilities.
- Increase access to facilities for children/teens.
- Deters child and youth delinquency.
- Repurpose old vacant buildings for youth engagement.
-
Crime Prevention.
- More community centers.
- Incentives for Apple and other computer companies to assist with money (for computer equipment - job training and development).
PROPOSALS
Section titled “PROPOSALS”- K-12 curriculum to teach urban planning and development.
- Sacramento County Community Centers to promote youth activities and decrease crime.
- Incentive programs for homeowners.
- Land development waivers for disadvantaged neighborhoods.
- Rotate farmers markets and educate families on how to prepare healthy foods.
- Increase density in single-family homes to address displacement.
OTHER COMMENTS (NOT CAPTURED BY FACILITATOR NOTES)
Section titled “OTHER COMMENTS (NOT CAPTURED BY FACILITATOR NOTES)”- Homeless situation - use big box buildings for triage center for homeless.
- Blocks that are dark - use lights with trigger system.
- Expand RT micro transit system.
- Homeownership - Many people in disadvantaged communities do not think that homeownership is possible.
- Develop a training program to help people buy a home - that it is possible to own a house.
- Need for inclusionary housing - small subdivision has 10 homes; two has to be used for affordable housing.
- SHRA has a homeownership program but nobody knows about it.
- Before the recession, banks and mortgage companies were focusing on disadvantaged areas to sell bad mortgages (subprime loans).
- Provide air filters for neighbors of a development project.
- County’s development project signs - make them to be able to be scanned so people do have to park and get out of the car to read.
- Recreation facilities are too far - make facilities available and accessible.
- Issue - how to get people to the community centers.
- Community centers without children. Good centers to emulate - Wackford and Pannell.
- Lack of lights at parks for activities during evenings.
- Healthy food access ideas:
- Grow own food in backyard.
- Composting workshops
- Gardening workshops
- Edible landscaping
- Farmer’s markets
- Ability to use food stamps.
- People do not know what to do with the fresh produce
- Workshops on cooking
- Grow own food in backyard.